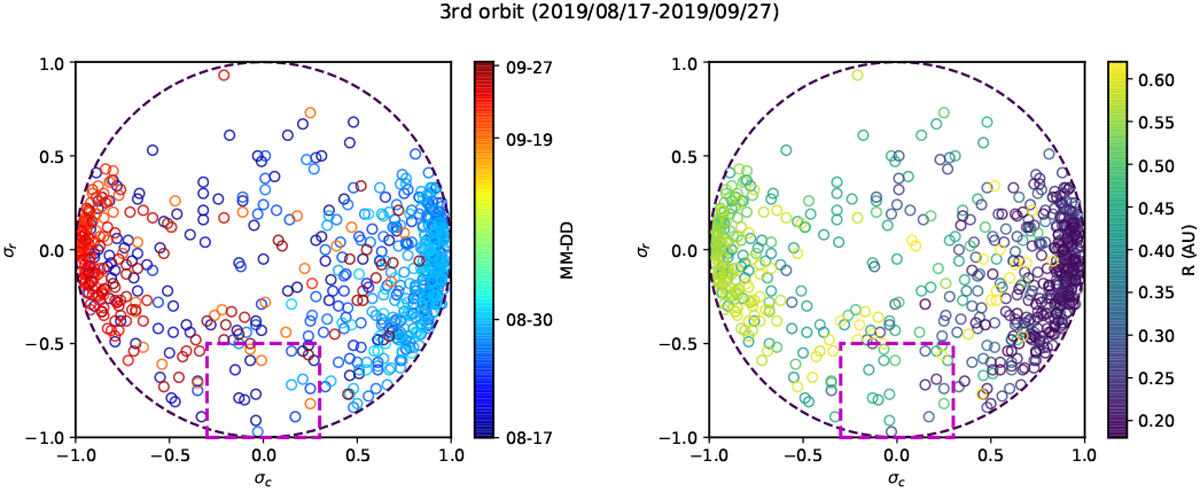
Fig. 4

Normalized cross helicity σc vs. normalized residual energy σr for structures with a high magnetic helicity (|σm|≥ 0.7) identified in the third orbit. We note that there is a lack of plasma data during the periods from 2019 August 31 to 2019 September 18, as well as between 2019 August 20 and 2019 August 21. Left panel: the scatter circles are colored according to the date. Right panel: the points are colored according to the radial distance to the Sun. The dashed-dotted circle represents
![]() . The magenta rectangular box represents the region that likely contains flux rope structures with a low value of normalized cross helicity|σc|≤ 0.3 and a highly negative residual energy σr ≤−0.5.
. The magenta rectangular box represents the region that likely contains flux rope structures with a low value of normalized cross helicity|σc|≤ 0.3 and a highly negative residual energy σr ≤−0.5.
Current usage metrics show cumulative count of Article Views (full-text article views including HTML views, PDF and ePub downloads, according to the available data) and Abstracts Views on Vision4Press platform.
Data correspond to usage on the plateform after 2015. The current usage metrics is available 48-96 hours after online publication and is updated daily on week days.
Initial download of the metrics may take a while.


