Fig. 1
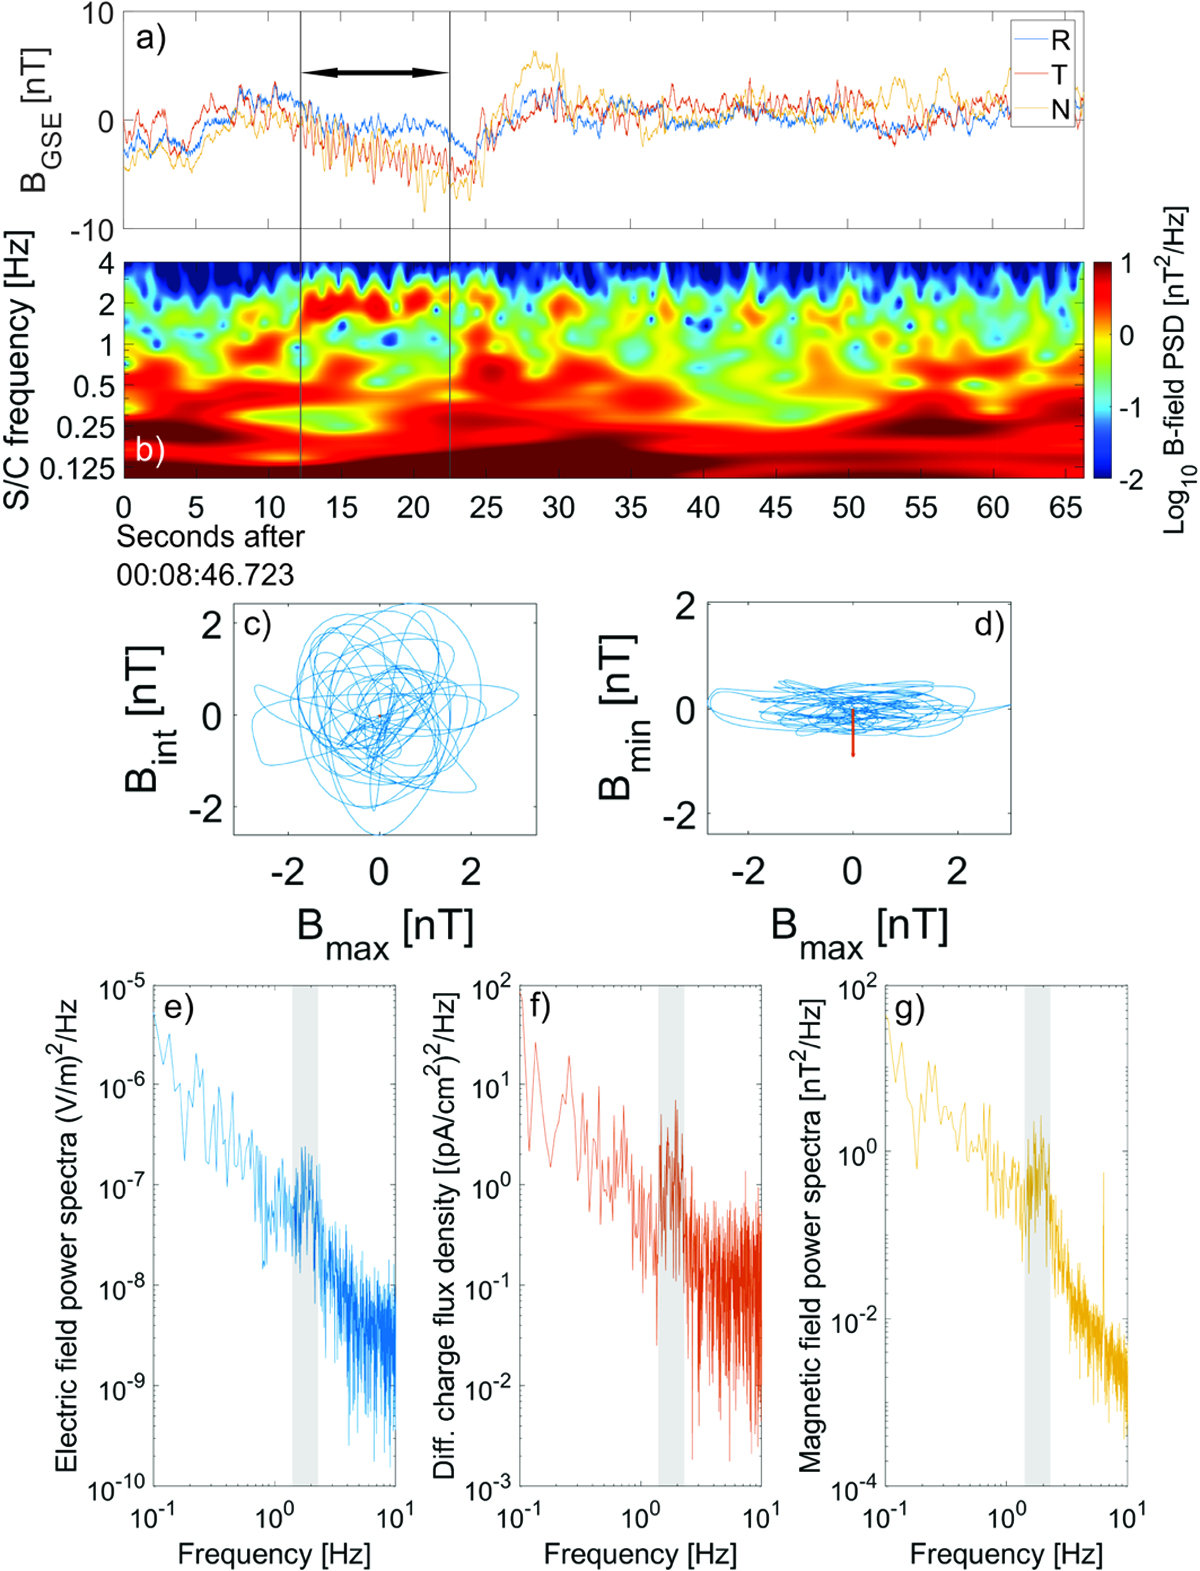
(a) Fluxgate magnetometer data (66 s averaged subtracted) and (b) trace power spectra of the magnetic field fluctuations. (c and d) Hodogramsshowing band-pass filtered (0.6–4 Hz) fluctuations for the interval marked with an arrow in panel a in the maximum-intermediate and maximum-minimum variance planes. The red arrow in panel d shows B0. Panels e–g: power spectra density of the electric field, differential charge flux density and magnetic field fluctuations, respectively.The frequency range with wave activity (1.4–2.3 Hz) is marked with gray shade.
Current usage metrics show cumulative count of Article Views (full-text article views including HTML views, PDF and ePub downloads, according to the available data) and Abstracts Views on Vision4Press platform.
Data correspond to usage on the plateform after 2015. The current usage metrics is available 48-96 hours after online publication and is updated daily on week days.
Initial download of the metrics may take a while.