Fig. A.1
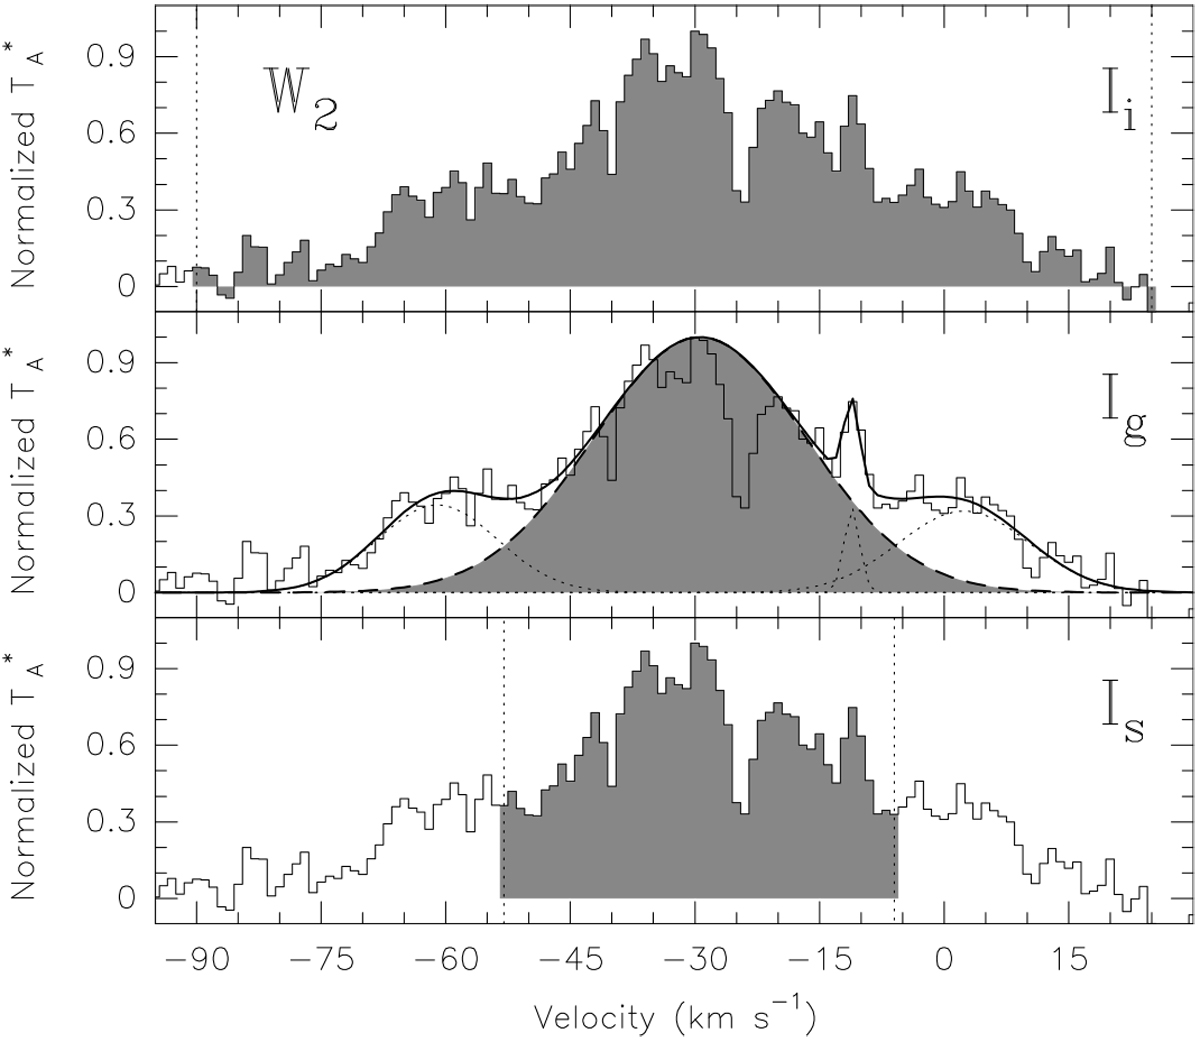
Graphical description of the approach adopted to derived Ig, Is, and Ii integrated intensities for the [CII] and [NII] line observations, as described in Sect. 3. In the example, the spectra in the upper, middle, and lower panels correspond to the [CII] line at the W2 position. The spectra were normalized to the peak antenna temperature for display purposes.
Current usage metrics show cumulative count of Article Views (full-text article views including HTML views, PDF and ePub downloads, according to the available data) and Abstracts Views on Vision4Press platform.
Data correspond to usage on the plateform after 2015. The current usage metrics is available 48-96 hours after online publication and is updated daily on week days.
Initial download of the metrics may take a while.