Fig. 6
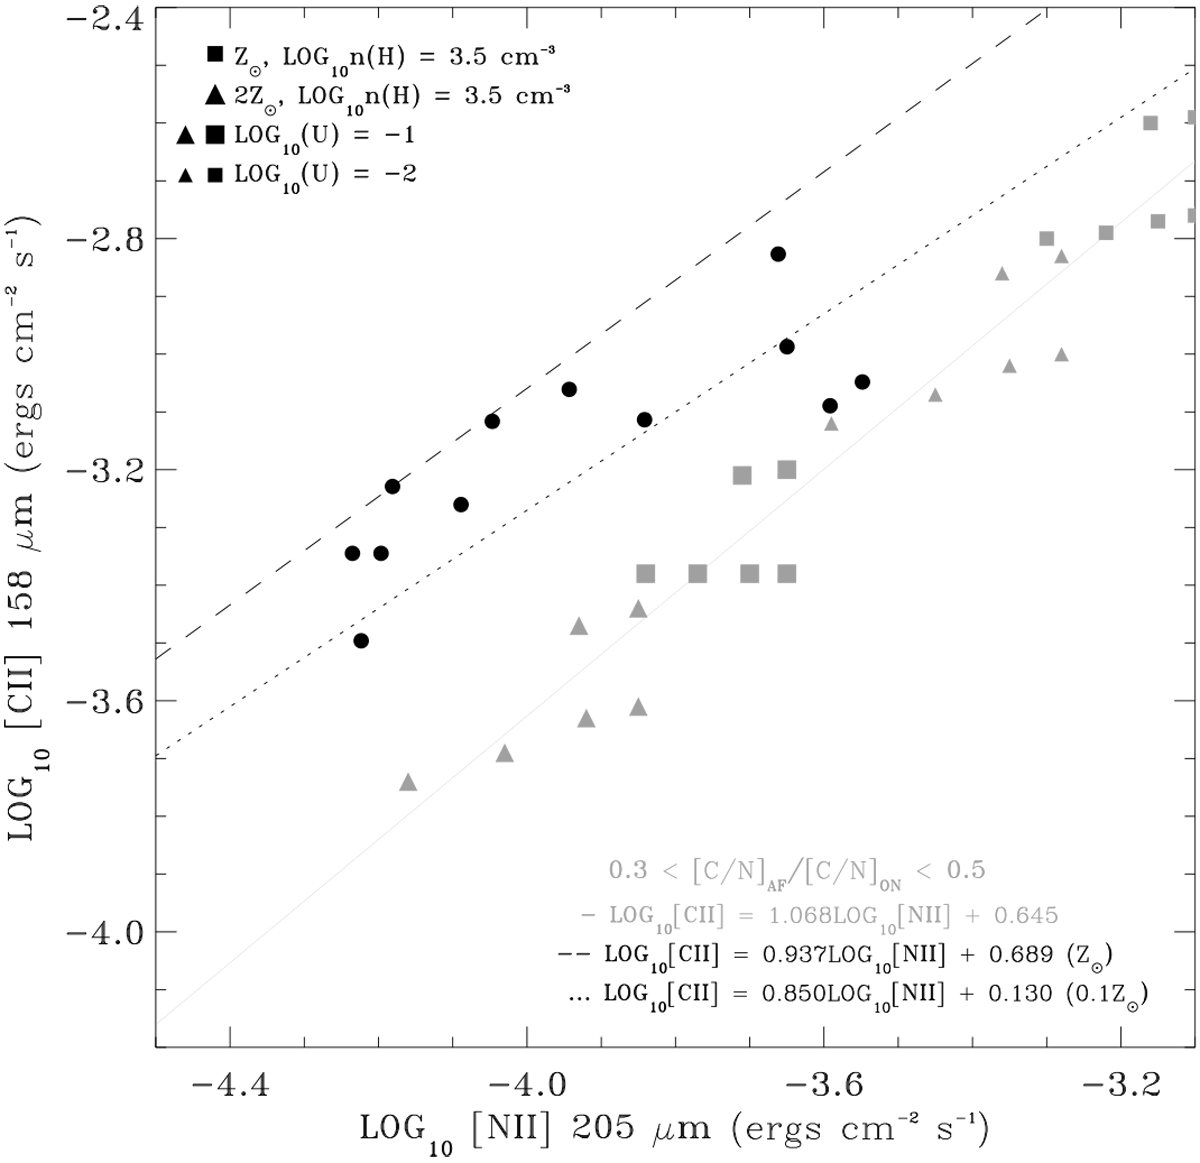
Scatter plot of I([CII])g versus I([NII])s integrated intensities for radial velocity components listed in Table 2. Data points are shown as filled black circles, while model points satisfying 0.3 < [C/N]AF/[C/N]ON < 0.5 are shown in gray, with symbol shape and size depending on the gas physical parameters, as listed in the upper left corner of the figure. A least-squares fit to the model predictions yields log I([CII]HII) = 1.068 × log I([NII]) + 0.645, shown by the gray straight line. For comparison, the expected [CII] emission contribution from H II regions in the Abel (2006) models for 1.0 Z⊙ and 0.1 Z⊙ are shown as dashed and dotted black straight lines, respectively.
Current usage metrics show cumulative count of Article Views (full-text article views including HTML views, PDF and ePub downloads, according to the available data) and Abstracts Views on Vision4Press platform.
Data correspond to usage on the plateform after 2015. The current usage metrics is available 48-96 hours after online publication and is updated daily on week days.
Initial download of the metrics may take a while.