Fig. 5
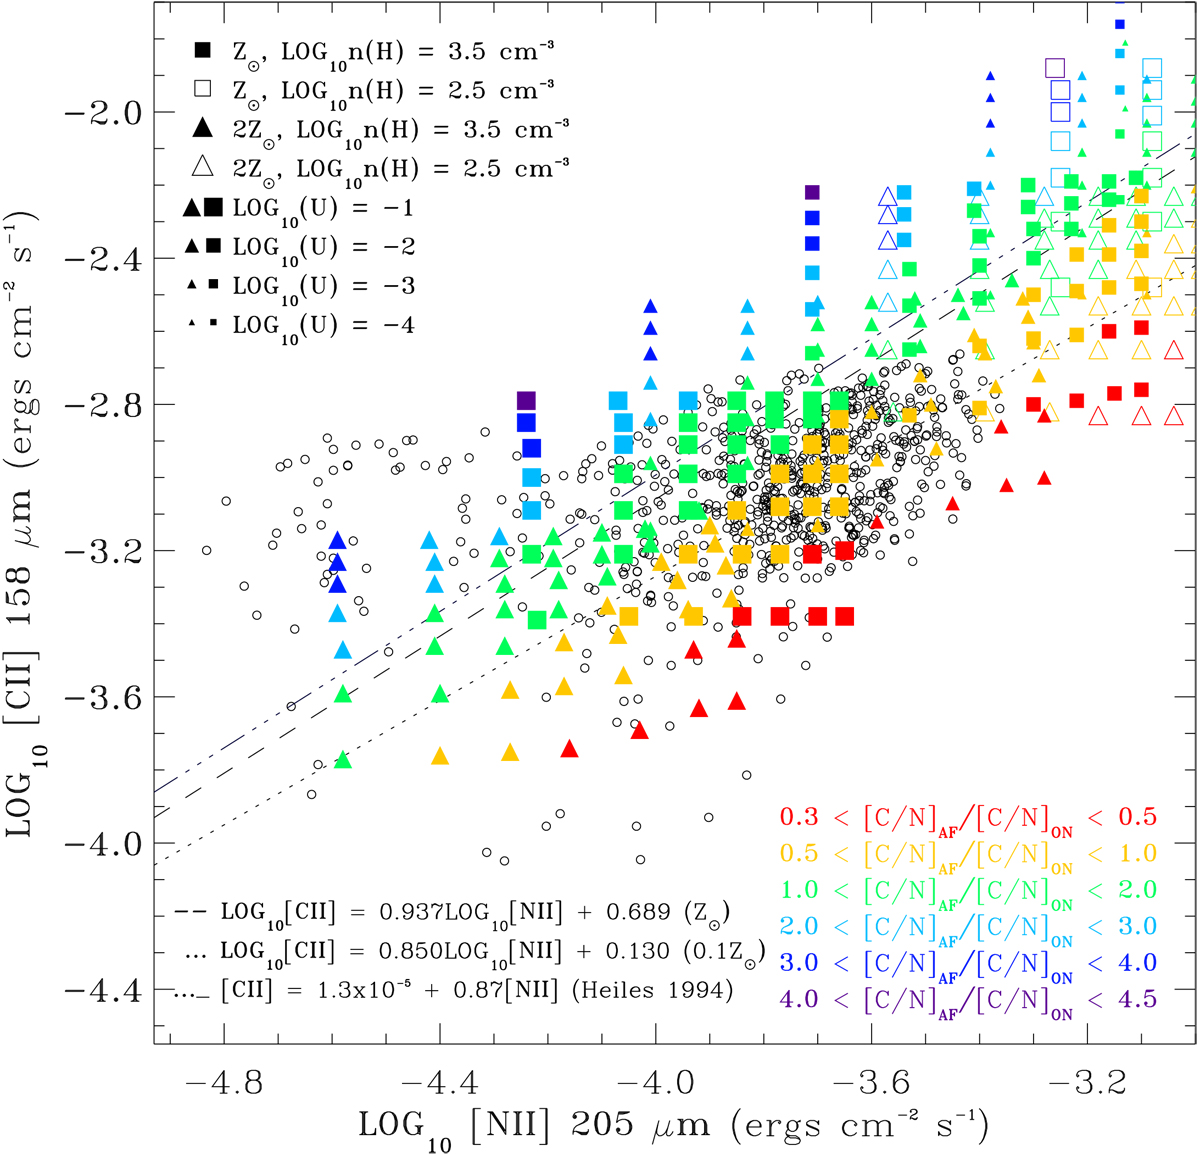
Scatter plot of the I([CII])i versus I([NII])i integrated intensities. Data points are shown as open black circles. The Abel (2006) predictions for the [CII] emission contribution from H II regions, for metallicities 1.0 Z⊙ and 0.1 Z⊙ (Eqs. (1) and (2) in their work), and the Heiles (1994) linear correlation between I([CII]) and I([NII]) for the extended low-density warm ionized medium (ELDWIM; Eq. (12b) in their work) are shown as dashed, dotted, and dotted-dashed lines, respectively. The model predictions in this work, using different [C/N] abundance ratios normalized to the Galactic disk value in Simón-Díaz & Stasińska (2011) are displayed in colors. Metallicities 1.0 Z⊙ and 2.0 Z⊙ are shown asfilled and open ■ and ▴ symbols for log n(H) = 3.5 and 2.5, respectively. The symbol size is proportional to the ionization parameter log10 U = −1, −2,−3, and −4.
Current usage metrics show cumulative count of Article Views (full-text article views including HTML views, PDF and ePub downloads, according to the available data) and Abstracts Views on Vision4Press platform.
Data correspond to usage on the plateform after 2015. The current usage metrics is available 48-96 hours after online publication and is updated daily on week days.
Initial download of the metrics may take a while.