Fig. 4
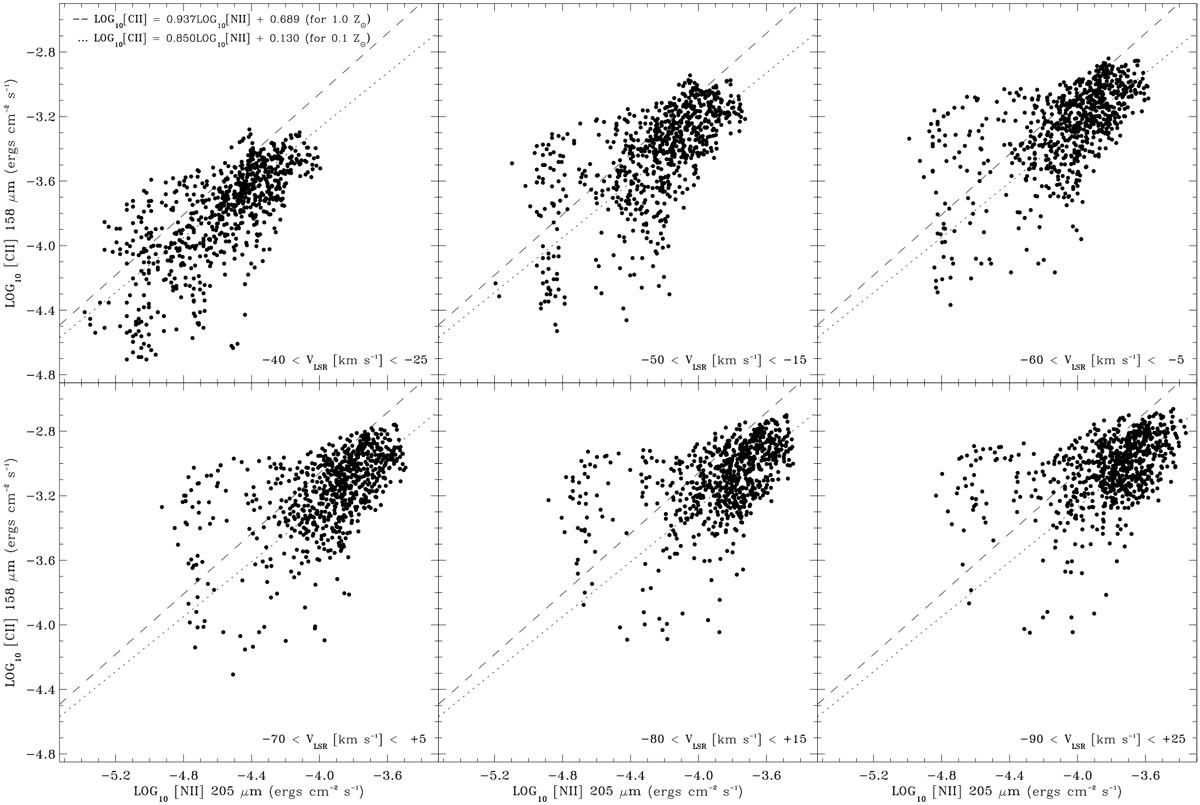
Scatter plot of I([CII]) versus I([NII]) integrated intensities calculated for increasingly larger radial velocity ranges from −40 to −25 km s−1, −50 to −15 km s−1, −60 to −5 km s−1, −70 to +5 km s−1, −80 to +15 km s−1, and −90 to +25 km s−1 (corresponding to I([CII])i versus I([NII])i). The I([CII]) versus I([NII]) relationship in Abel (2006) for metallicities 1.0 Z⊙ and 0.1 Z⊙ are shown as dashed and dotted straight lines in each panel. As the radial velocity range increases, the bulk of the data points move along the Abel (2006) prediction scale for the [CII] emission contribution of H II regions.
Current usage metrics show cumulative count of Article Views (full-text article views including HTML views, PDF and ePub downloads, according to the available data) and Abstracts Views on Vision4Press platform.
Data correspond to usage on the plateform after 2015. The current usage metrics is available 48-96 hours after online publication and is updated daily on week days.
Initial download of the metrics may take a while.