Fig. 3
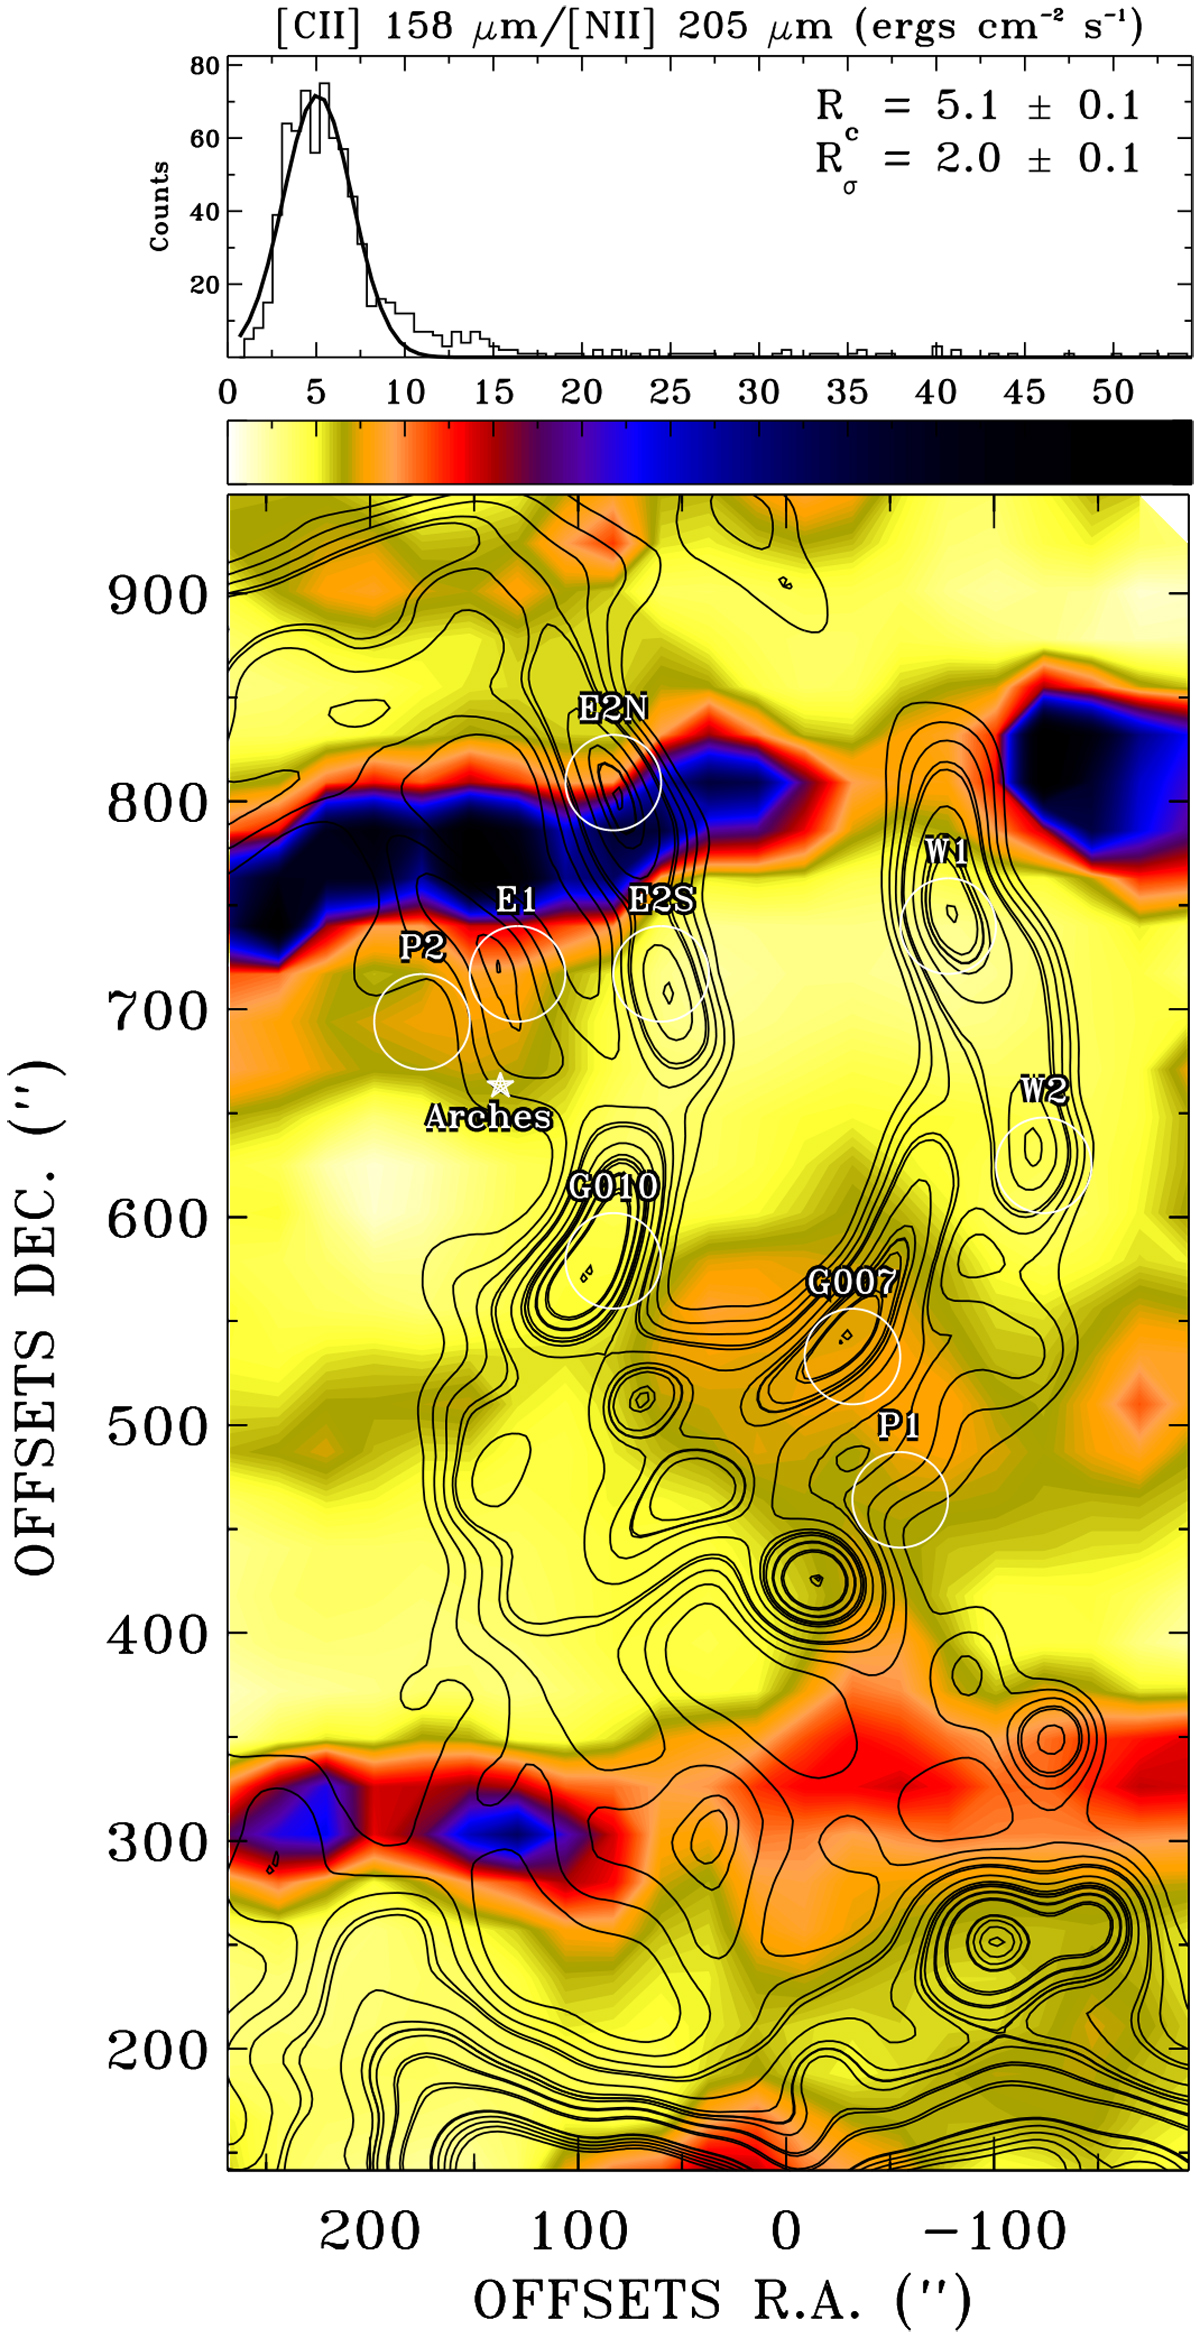
Bottom: spatial distribution of the I([CII])i/I([NII])i integrated intensity ratio calculated for the radial velocity range −90 km s−1 to +25 km s−1. The AF traced by 20 cm continuum observations and the selected positions in Table 1 are shown as black contours and white circles, respectively. The white ⋆ symbol represents the location of the Arches Cluster. Top: histogram of the spatial distribution of I([CII])i/I([NII])i integrated intensity ratios shown in the map. A Gaussian fit was performed to the histogram to characterize the central ratio (Rc) and standard deviation (Rσ) of the distribution.
Current usage metrics show cumulative count of Article Views (full-text article views including HTML views, PDF and ePub downloads, according to the available data) and Abstracts Views on Vision4Press platform.
Data correspond to usage on the plateform after 2015. The current usage metrics is available 48-96 hours after online publication and is updated daily on week days.
Initial download of the metrics may take a while.