Fig. 2
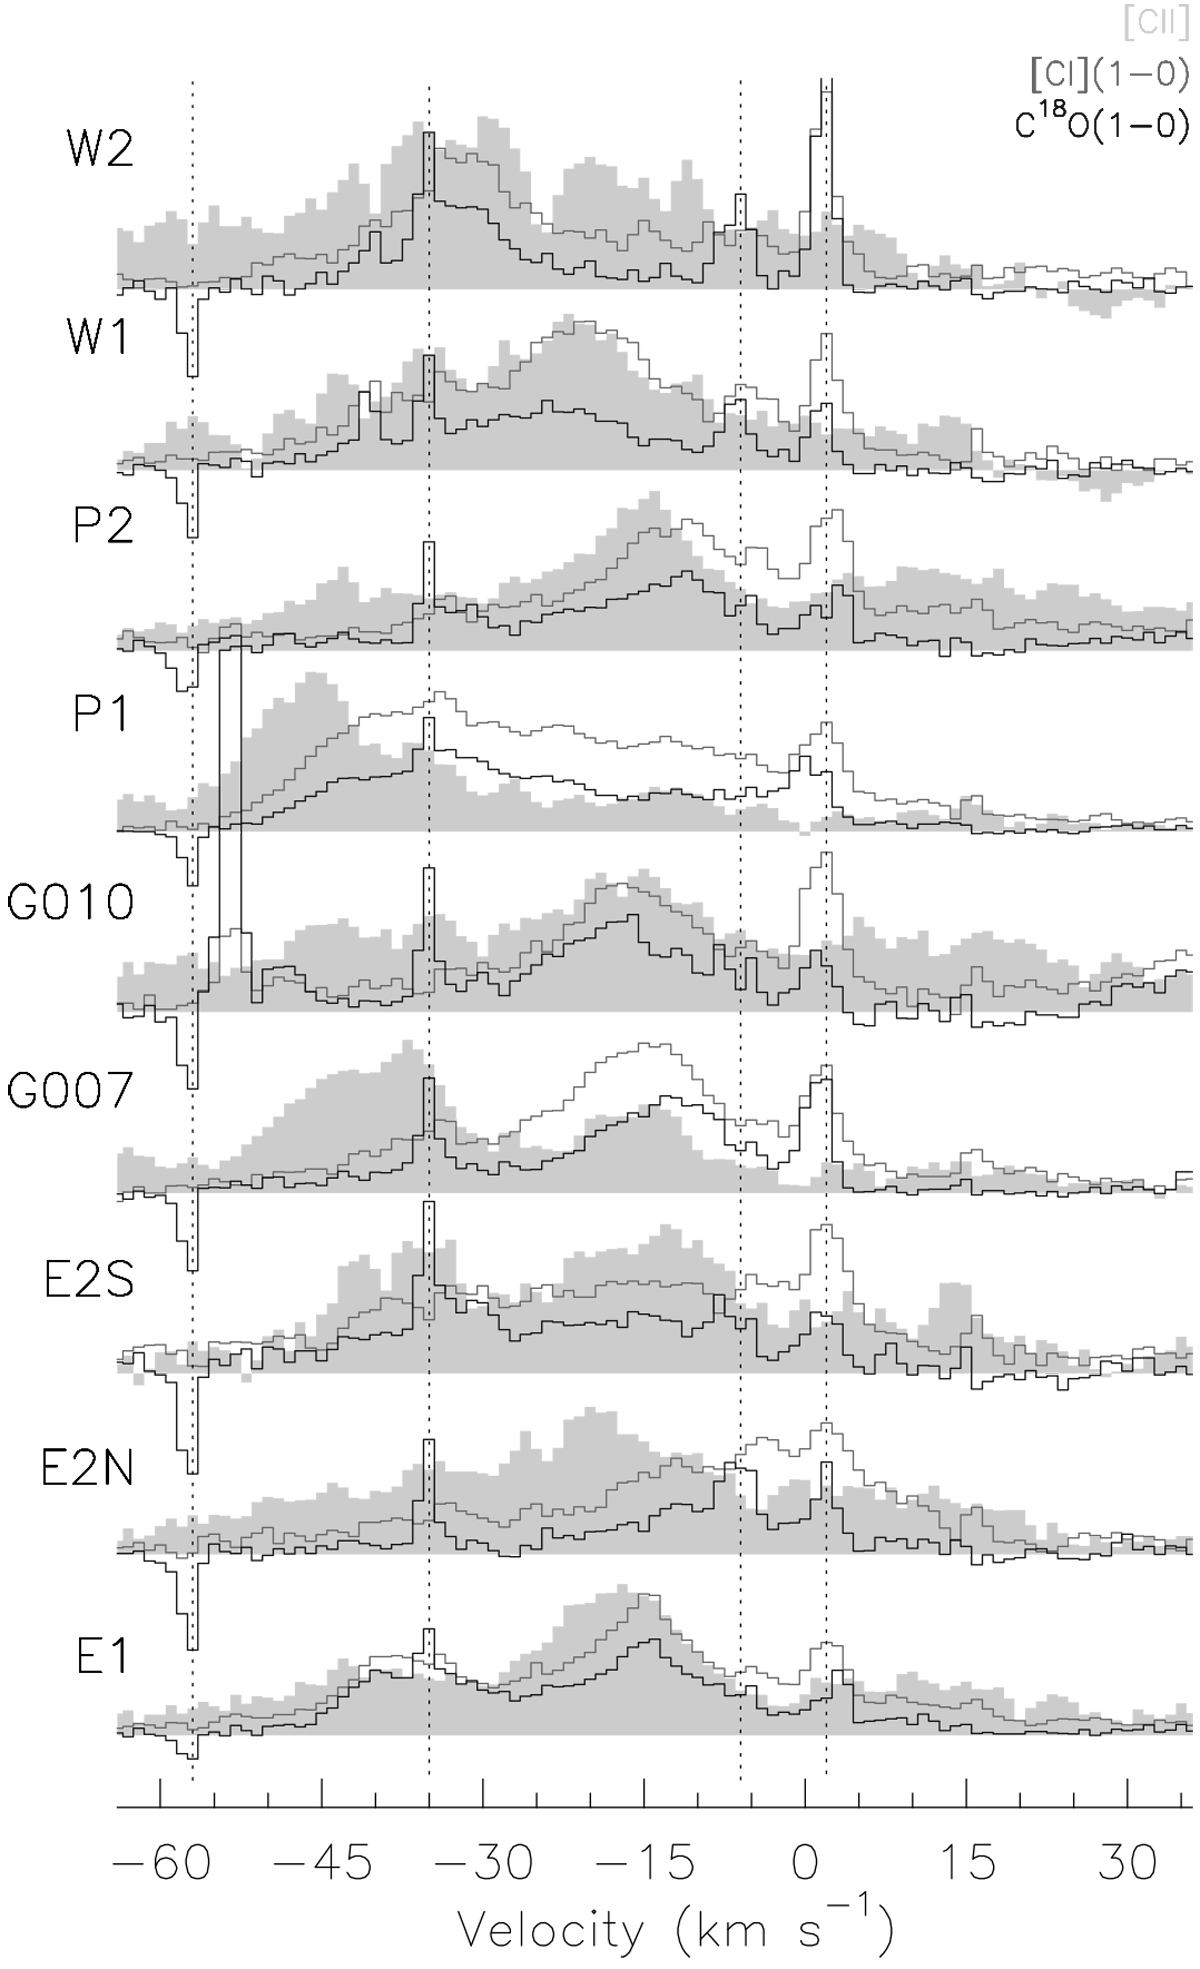
Comparison between [CII] (filled light gray), [CI](1–0) (gray), and C18O(1–0) (black) line profiles for all positions in Table 1. Relative intensities among the spectra have been scaled for display purposes. The observations trace different phases of the ISM from ionized, neutral, and molecular gas. Narrow and strong emission and absorption features in the C18 O(1–0) optically thin line common to all positions are marked with vertical dotted lines as they are most likely foreground components located in the Galactic disk somewhere along the LOS and outside the GC.
Current usage metrics show cumulative count of Article Views (full-text article views including HTML views, PDF and ePub downloads, according to the available data) and Abstracts Views on Vision4Press platform.
Data correspond to usage on the plateform after 2015. The current usage metrics is available 48-96 hours after online publication and is updated daily on week days.
Initial download of the metrics may take a while.