Fig. A.4
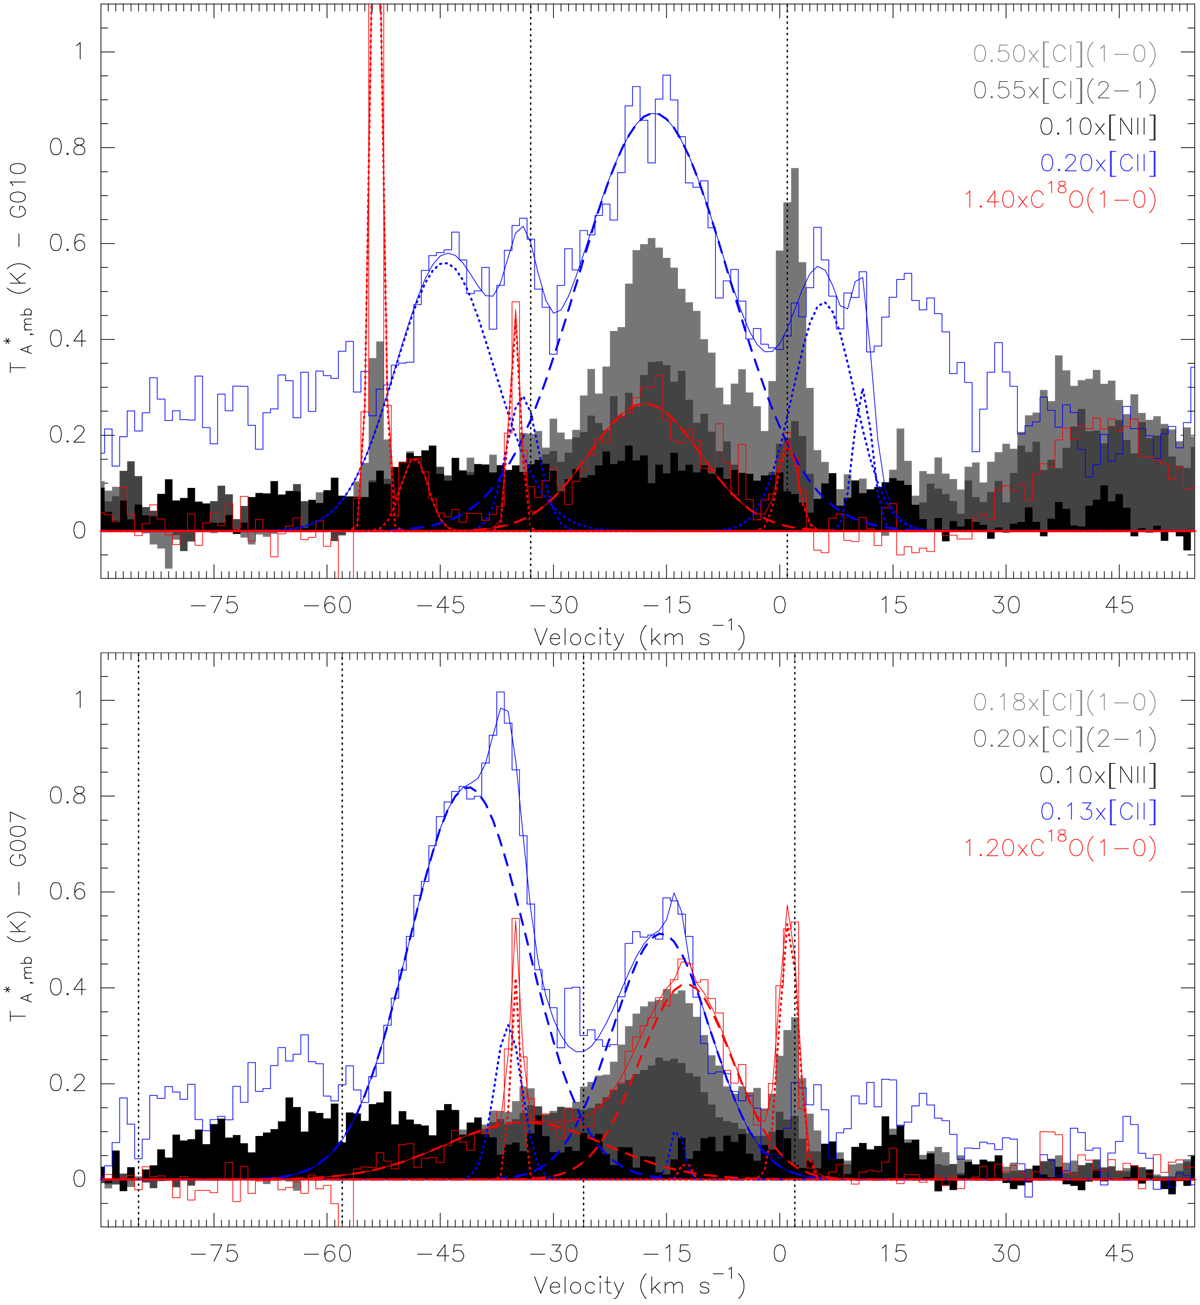
Comparison of [CII] (open blue), [NII] (filled black), [CI](2–1) (filled dark gray), [CI](1–0) (filled gray), and C18 O(1–0) (open red) spectra for positions G0.10+0.02 and G0.07+0.04 in Table 1. Antenna temperatures have been scaled by the factor shown next to the line’s name for display purposes. Gaussian component fits to the [CII] and C18 O(1–0) spectra are shown in blue and red, respectively. Only dashed-line Gaussian components in the [CII] spectra are used for the analysis in this work as only for them can a counterpart in the C18 O(1–0) optically thin emission be identified. Vertical dotted black lines show the radial velocity limits for which integrated intensities were calculated for the [NII] line by directly adding the observed emission, multiplied by the spectral channel width, to that LSR velocity range.
Current usage metrics show cumulative count of Article Views (full-text article views including HTML views, PDF and ePub downloads, according to the available data) and Abstracts Views on Vision4Press platform.
Data correspond to usage on the plateform after 2015. The current usage metrics is available 48-96 hours after online publication and is updated daily on week days.
Initial download of the metrics may take a while.