Fig. 1
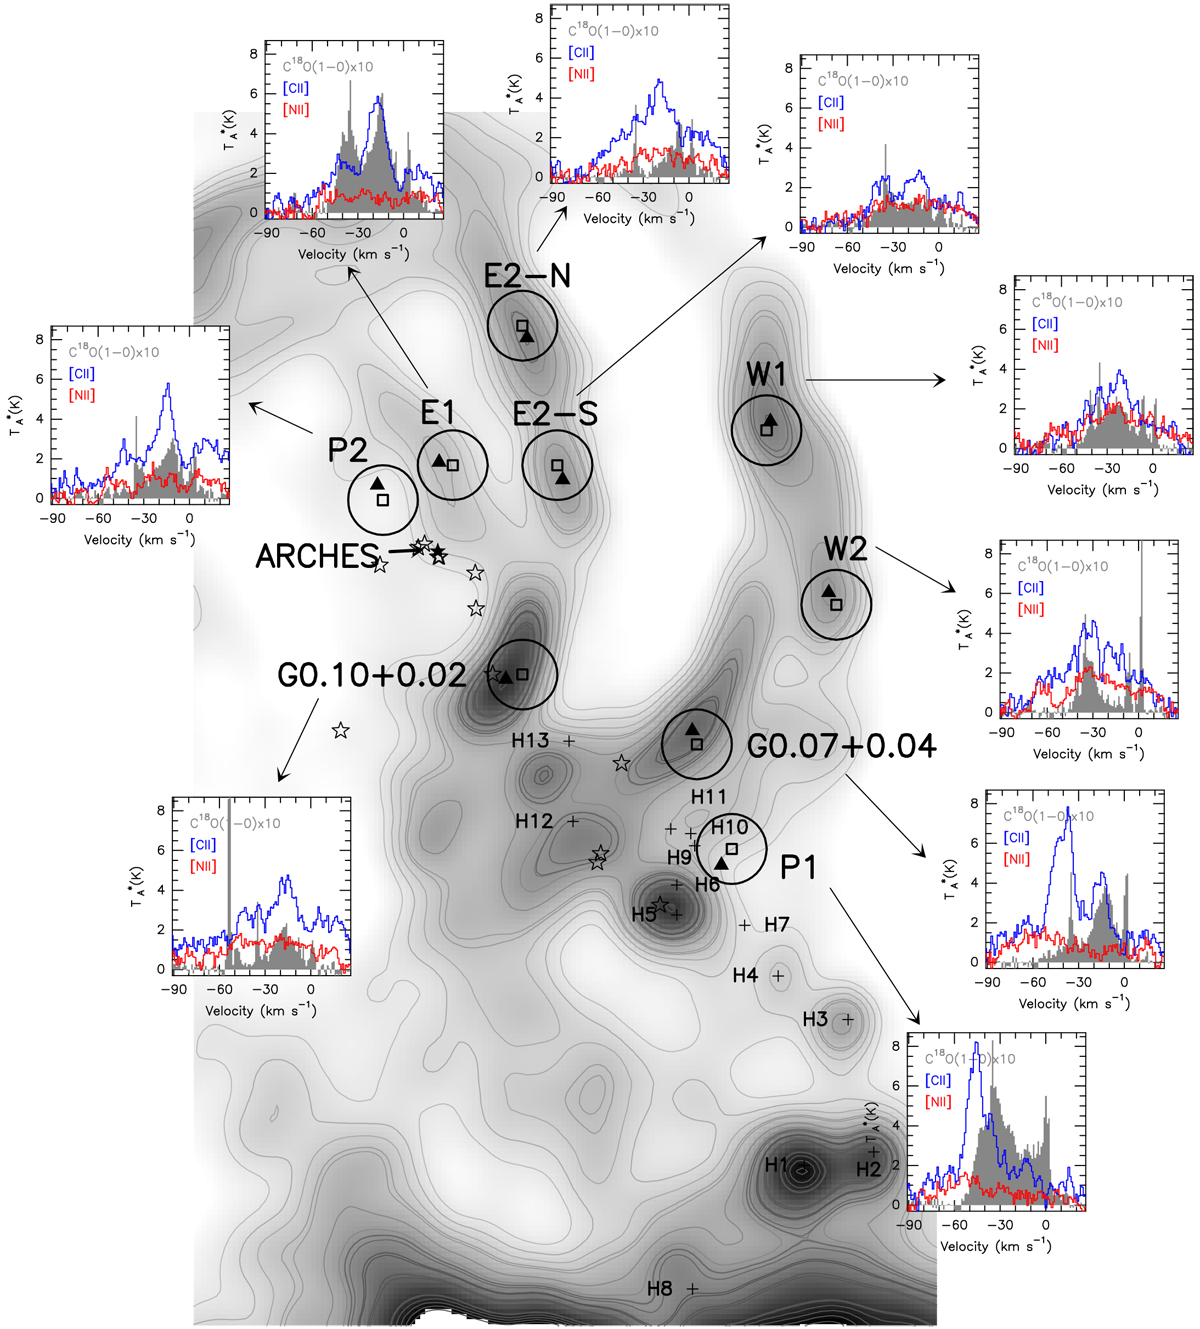
AF region outlined in 20 cm continuum emission from Yusef-Zadeh & Morris (1987). Selected positions for the I([CII]) versus I([NII]) integrated intensity analysis in this work: E1, E2-N, E2-S, W1, W2, G0.07+0.04, G0.10+0.02, P1, and P2, are shown as open squares in the García et al. (2016) data grid. The 46″ spatial resolution of their data is represented by open circles. Filled triangles depict either the closest continuumemission peak to each position or one of the two CS(2–1) peaks (P1 or P2) in the observations by Serabyn & Güsten (1987). Panel insets contain the [CII] (blue), [NII] (red), and scaled C18 O(1–0) (filled-gray) spectra at the positions selected for this work, showing very complex line profiles with large variations in line shape and brightness across the region. Black crosses show the positions of several H II regions labeled H1–H13 spanning a region south of the filaments (the so-called H-Region). The ⋆ symbol shows the position of the Arches Cluster, ☆ while (text here emptystar) symbols indicate the locations of some of the massive (O, B, and WR) field stars scattered across the region (Dong et al. 2012, 2015).
Current usage metrics show cumulative count of Article Views (full-text article views including HTML views, PDF and ePub downloads, according to the available data) and Abstracts Views on Vision4Press platform.
Data correspond to usage on the plateform after 2015. The current usage metrics is available 48-96 hours after online publication and is updated daily on week days.
Initial download of the metrics may take a while.