Fig. 9
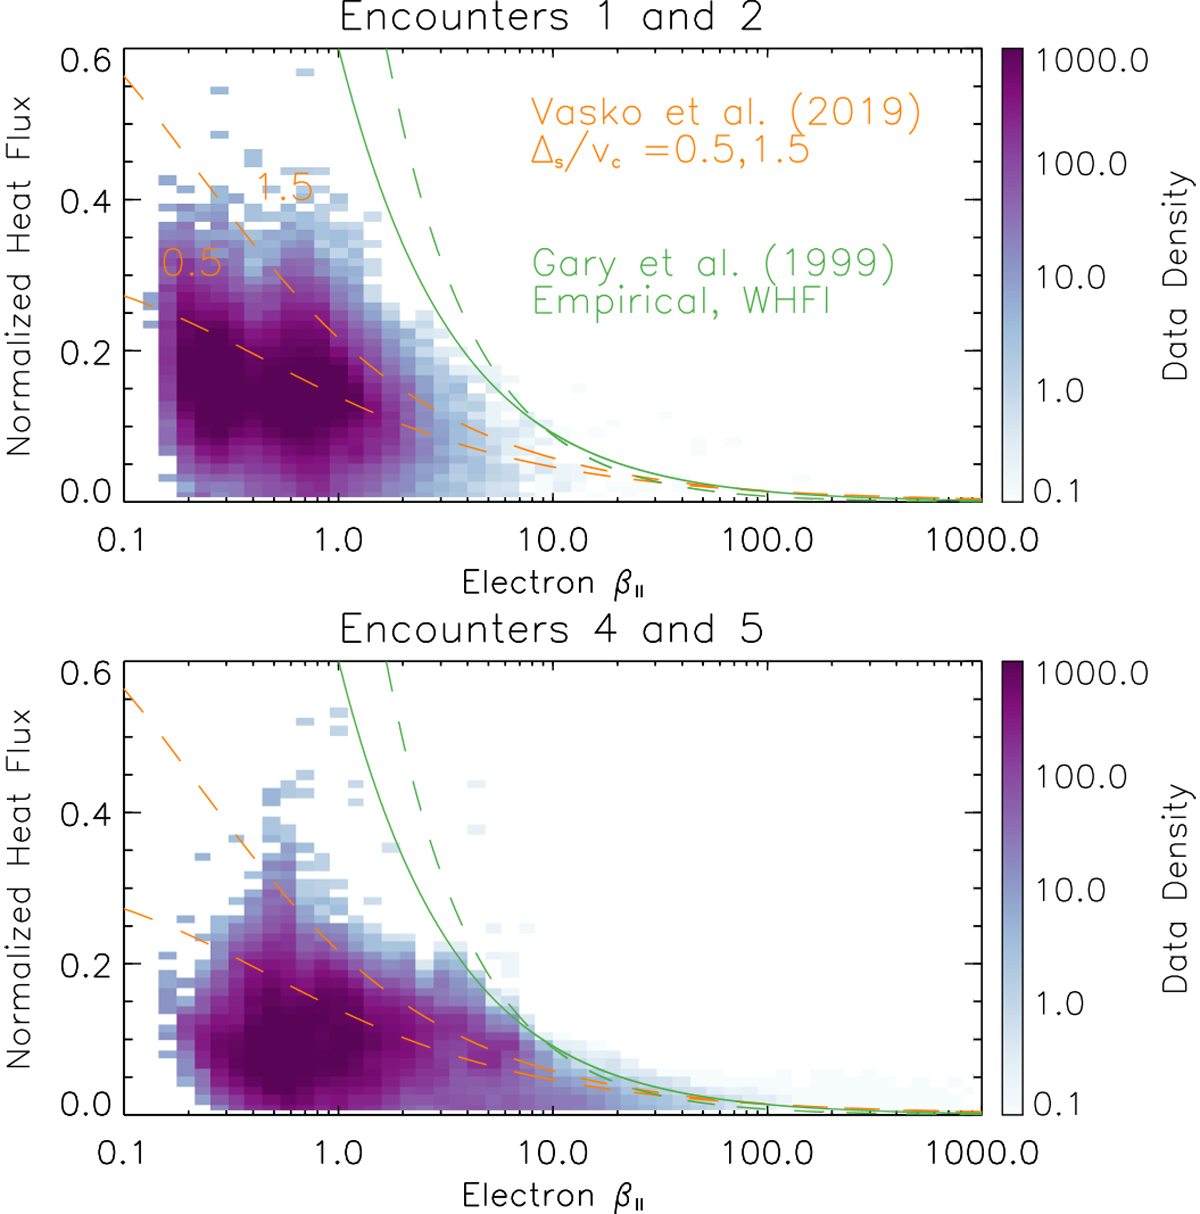
Beta-dependent electron heat flux constraints. The two panels show 2-d frequency distributions of normalized electron heat flux and β|| from heliocentric distances <0.25 AU from the first two PSP orbits (top panel) and from the fourth and fifth orbits (bottom panel). Orange lines indicate theoretical thresholds for the whistler fan instability (Vasko et al. 2019) and green lines indicate an empirical threshold (solid) and a theoretical threshold (dashed) for the whistler heat flux instability (Gary et al. 1999).
Current usage metrics show cumulative count of Article Views (full-text article views including HTML views, PDF and ePub downloads, according to the available data) and Abstracts Views on Vision4Press platform.
Data correspond to usage on the plateform after 2015. The current usage metrics is available 48-96 hours after online publication and is updated daily on week days.
Initial download of the metrics may take a while.