Fig. 6
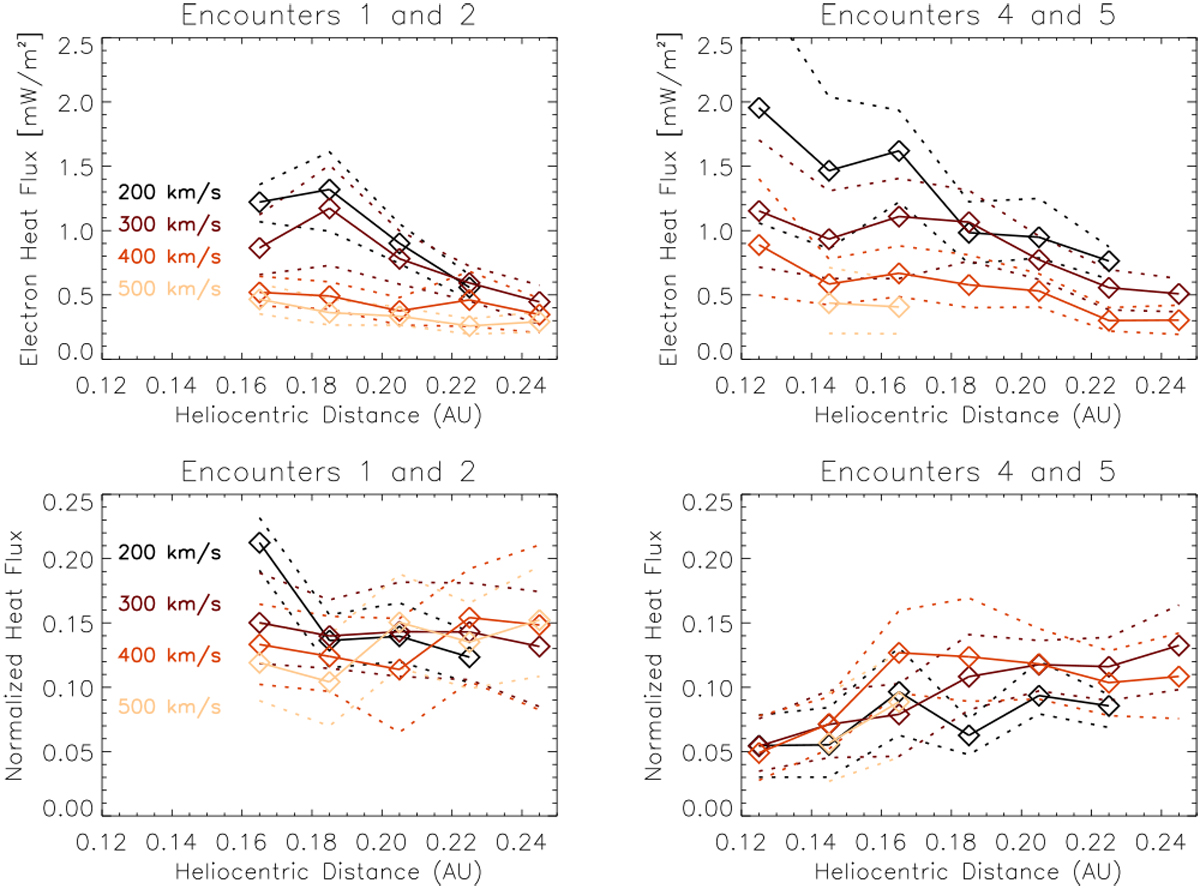
Electron heat flux as a function of heliocentric distance and solar wind speed. Top panels: net heat flux magnitudes, and bottom panels: normalized net heat flux magnitudes, for the first and second (left panels) and the fourth and fifth (right panels) PSP orbits. The solid lines and diamonds show median values in five solar wind speed bins (each 100 km s−1 in width), and the corresponding dashed lines show the upper and lower quartiles.
Current usage metrics show cumulative count of Article Views (full-text article views including HTML views, PDF and ePub downloads, according to the available data) and Abstracts Views on Vision4Press platform.
Data correspond to usage on the plateform after 2015. The current usage metrics is available 48-96 hours after online publication and is updated daily on week days.
Initial download of the metrics may take a while.