Fig. 9
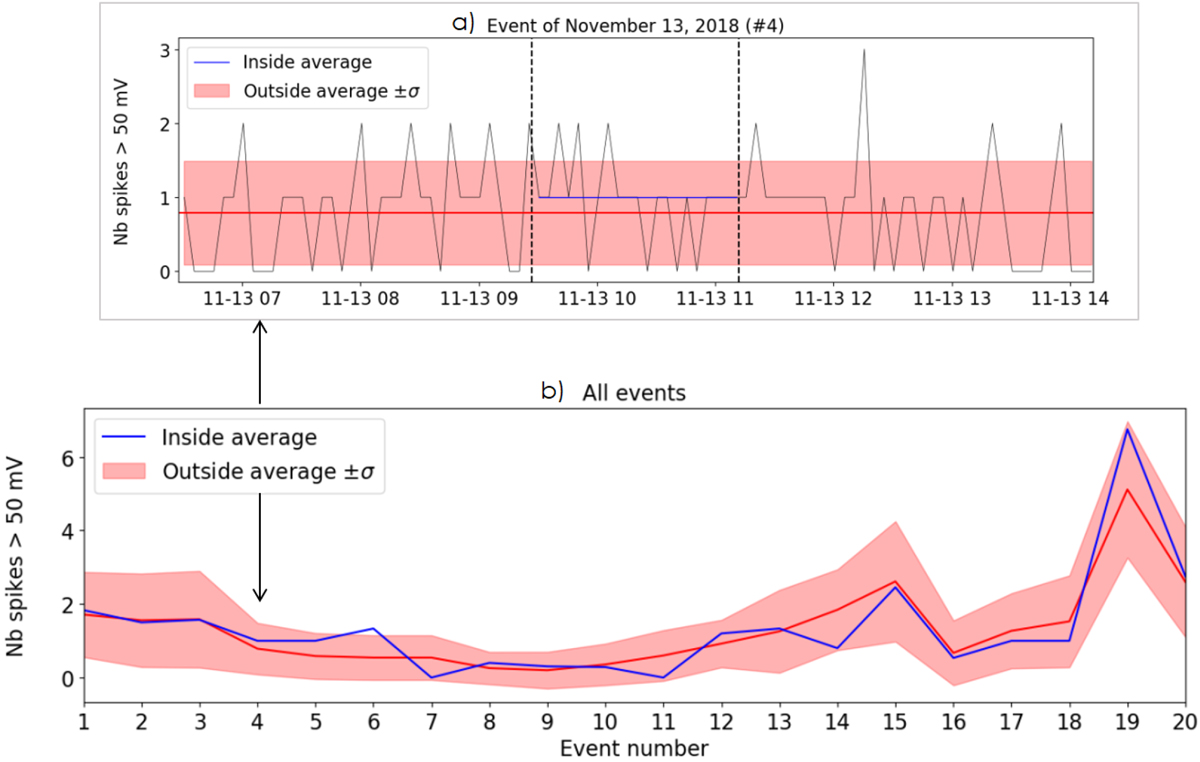
Analysis of PSP dust measurements in the vicinity of MICCS. (a) Number of voltage spikes superior to 50mV from the V2 antenna as a function of time, around the event described in Sect. 4 (delimited with dashed lines). The red line is the average of the number of spikes on a ±3h interval around the MICCS, and the red shaded area delimits a 1 σ standard deviation. The blue line is the average inside the structure. (b) Same statistical quantities for all events. The red curve is the averaged number of spikes for each event surrounded by the ± 1σ shaded area, and the blue curve is the average number of spikes inside each MICCS.
Current usage metrics show cumulative count of Article Views (full-text article views including HTML views, PDF and ePub downloads, according to the available data) and Abstracts Views on Vision4Press platform.
Data correspond to usage on the plateform after 2015. The current usage metrics is available 48-96 hours after online publication and is updated daily on week days.
Initial download of the metrics may take a while.