Fig. 8
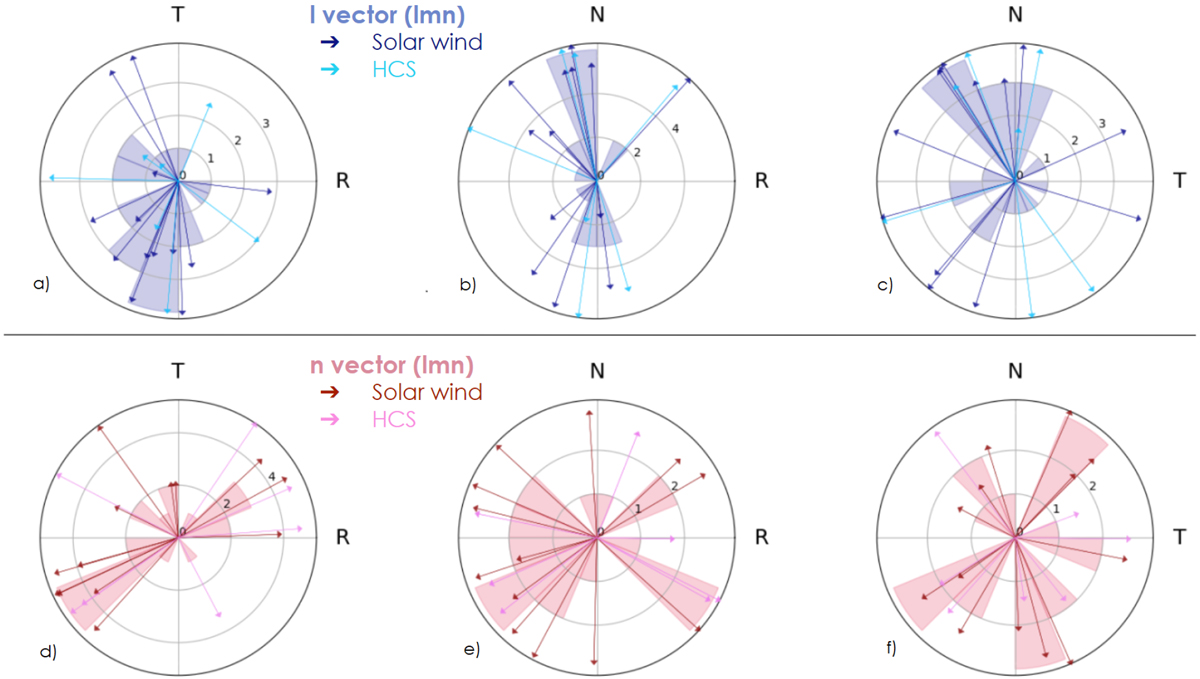
MICCS central current sheet lmn orientation. Top panels: l vectors projected in the RT (left), RN (center), and TN (right) plane, with a solar wind event in dark blue and HCS events in light blue. A polar bar chart is over plotted counting the number of arrows in a 22.5° bin. Bottom panels: n vectors in a similar manner, with a solar wind event in dark red and HCS events in magenta. See text for more details.
Current usage metrics show cumulative count of Article Views (full-text article views including HTML views, PDF and ePub downloads, according to the available data) and Abstracts Views on Vision4Press platform.
Data correspond to usage on the plateform after 2015. The current usage metrics is available 48-96 hours after online publication and is updated daily on week days.
Initial download of the metrics may take a while.