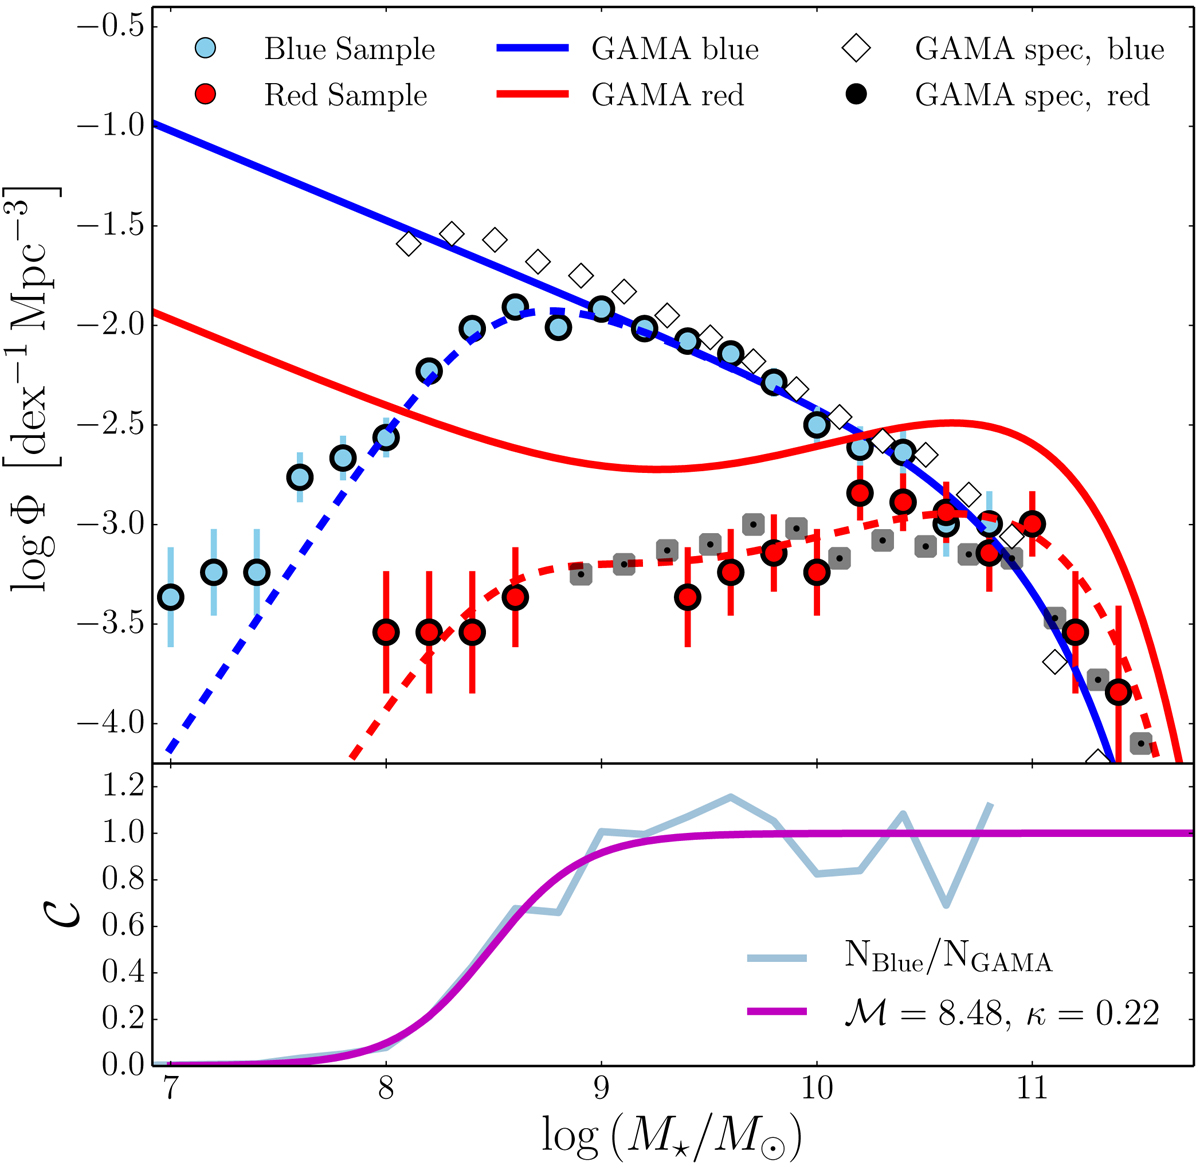
Fig. 9.

Upper panel: stellar mass function for the Blue sample (blue dots) and the Red sample (red dots). Blue and Red solid lines represent the SMF for blue and red galaxies respectively, taken from Baldry et al. (2012). White diamonds and black circles represent the SMF of spectroscopic Hα emitters in GAMA, taken from Gunawardhana et al. (2015). Dashed blue and red lines represent the GAMA blue and red SMF from Baldry et al. (2012), but multiplied by the Blue sample incompleteness, presented in the lower panel. An extra 0.35 factor is also applied to the red SMF from Baldry et al. (2012) to match the observed fraction of red galaxies with spectroscopic Hα emission from Gunawardhana et al. (2015). Bottom panel: stellar mass completeness estimated form the comparison between GAMA blue galaxies and Blue sample SMF (cyan solid line). The purple line is the best-fitting Sigmoid function to the completeness, whose parameters are labeled in the panel.
Current usage metrics show cumulative count of Article Views (full-text article views including HTML views, PDF and ePub downloads, according to the available data) and Abstracts Views on Vision4Press platform.
Data correspond to usage on the plateform after 2015. The current usage metrics is available 48-96 hours after online publication and is updated daily on week days.
Initial download of the metrics may take a while.


