Fig. 8.
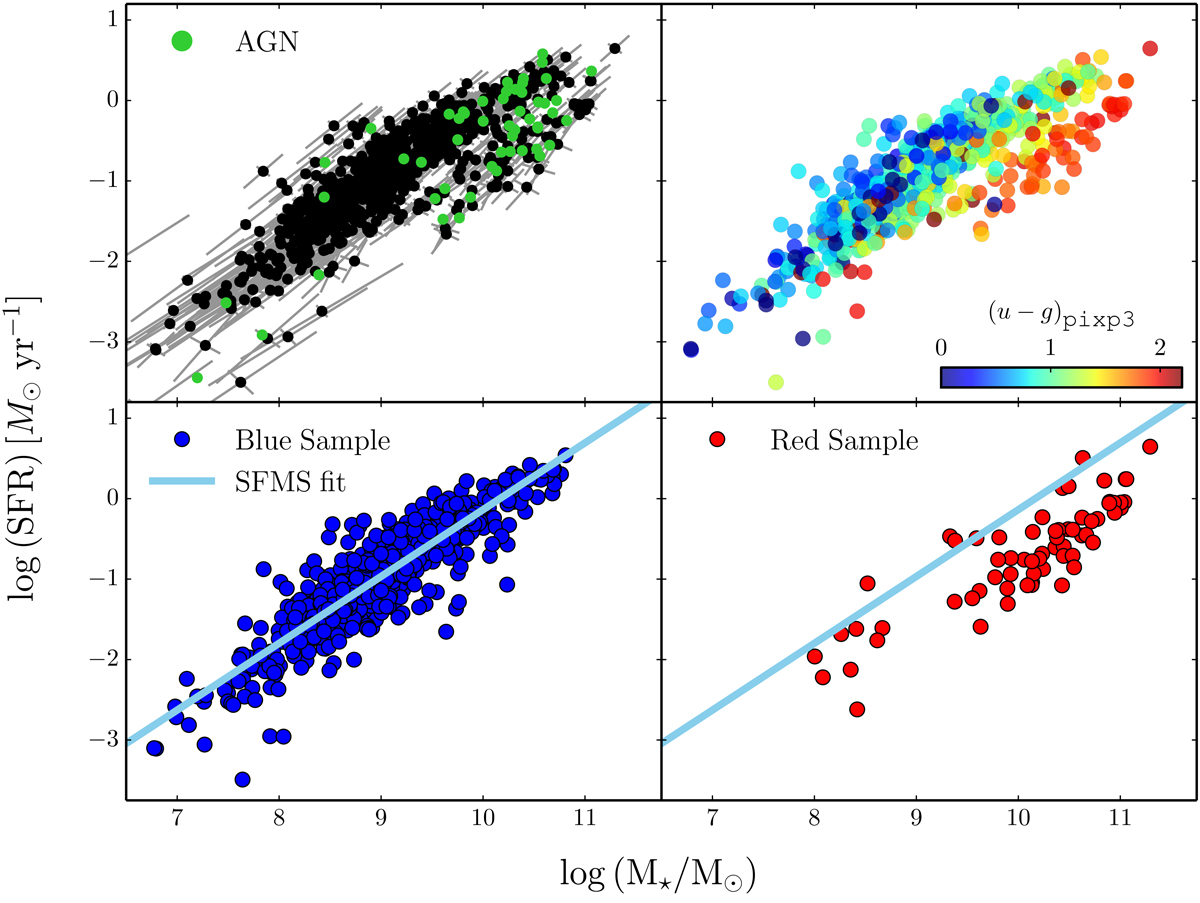
Star formation rate vs. stellar mass in the J-PLUS DR1 sample at d ≲ 75 Mpc. Upper left panel: relation for the Full sample (756 galaxies, bullets). The error bars provide the semi-major and semi-minor axis of the error ellipse, highlighting the covariance in the variables. The green dots mark the 49 AGN in the sample; these are shown here only with illustrative purposes, and are not taken into account when computing the main results of this work. Upper right panel: relation for the Full sample. The color of the points reflects the (u − g)pixp3 color of the galaxy, as scaled in the inner bar. Bottom left panel: relation for the Blue sample (689 galaxies). Bottom right panel: relation for the Red sample (67 galaxies). The solid line in both bottom panels is the best-fitting linear relation to the SFMS defined by the Blue sample.
Current usage metrics show cumulative count of Article Views (full-text article views including HTML views, PDF and ePub downloads, according to the available data) and Abstracts Views on Vision4Press platform.
Data correspond to usage on the plateform after 2015. The current usage metrics is available 48-96 hours after online publication and is updated daily on week days.
Initial download of the metrics may take a while.