Fig. 7.
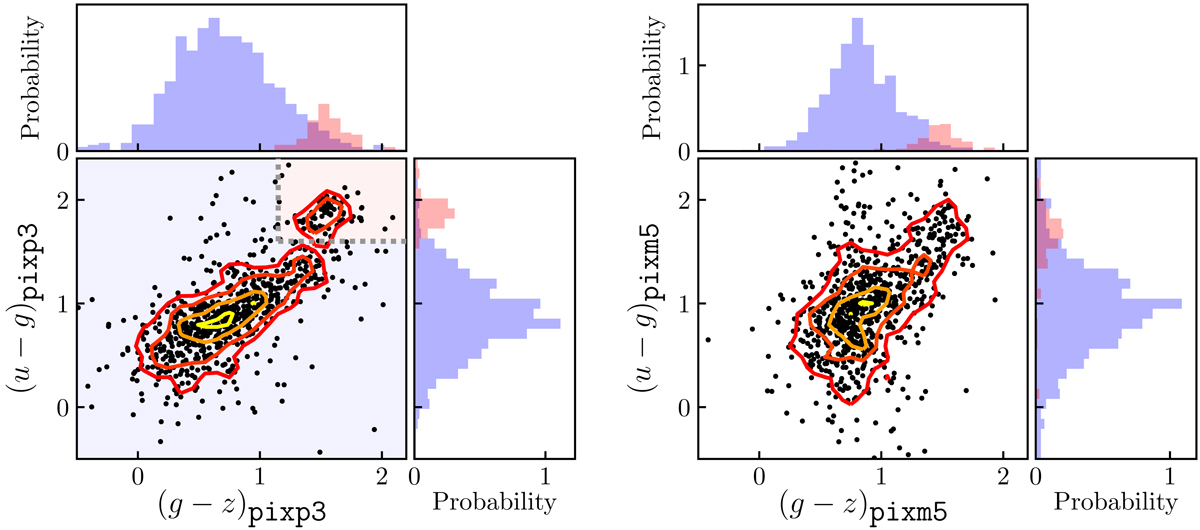
(u − g) vs. (g − z) color–color diagram of our local galaxy sample computed from pixels with signal-to-noise higher than 3 (pixp3; left panel) and higher than −5 (i.e., total colors, labeled as pixm5; right panel) in the Hα detection images. The colored contours show the density of sources to highlight the presence of local maxima. The dotted lines in the left panel mark our selection for the Red sample (red area), the Blue sample being the complementary set (blue area). The upper- and right-side normalized histograms are the density projections in (g − z) and (u − g), respectively. The red and blue shaded histograms in both panels mark the Red and Blue samples selected with pixp3 colors.
Current usage metrics show cumulative count of Article Views (full-text article views including HTML views, PDF and ePub downloads, according to the available data) and Abstracts Views on Vision4Press platform.
Data correspond to usage on the plateform after 2015. The current usage metrics is available 48-96 hours after online publication and is updated daily on week days.
Initial download of the metrics may take a while.