Fig. 5.
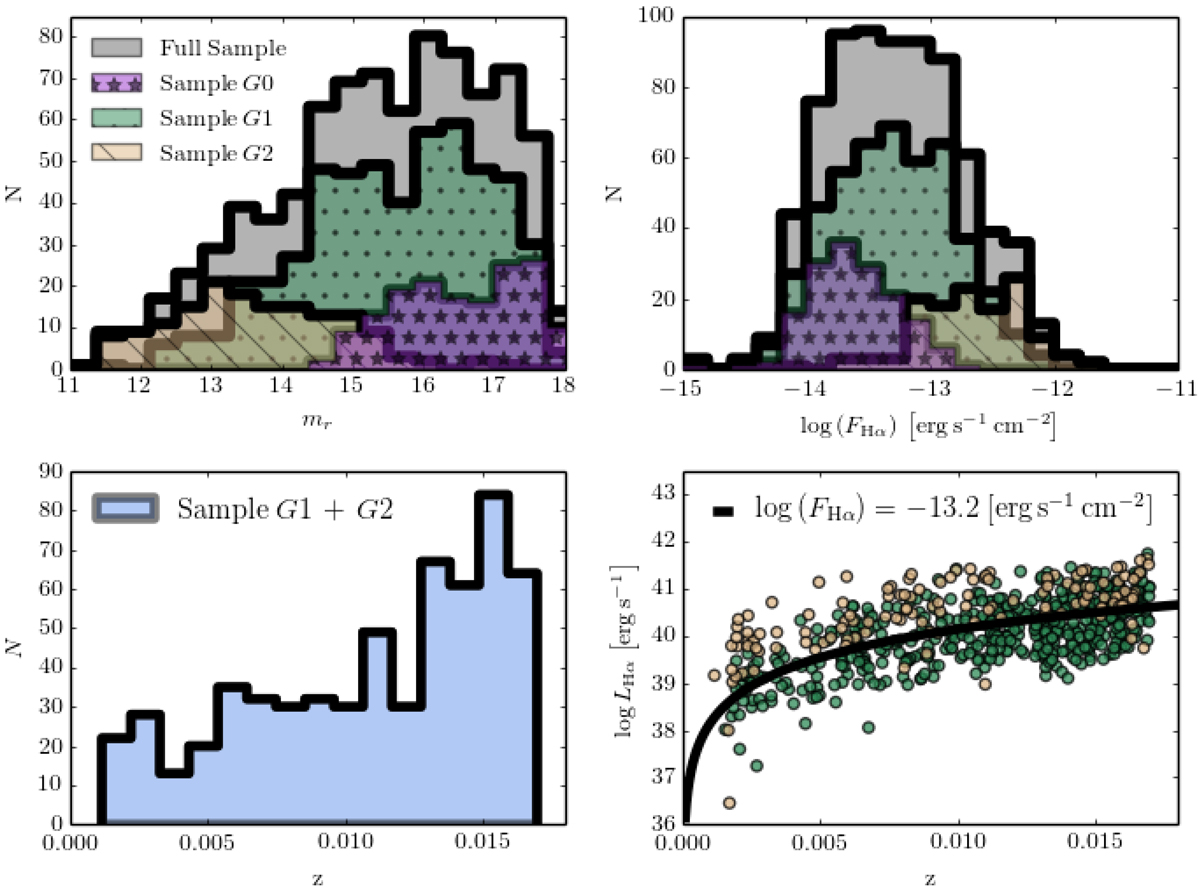
General properties of the J-PLUS DR1 local sample at z ≤ 0.017. Upper left panel: distribution in the r-band apparent magnitude. The three sub-samples with different distance information are labeled in the panel (see Sect. 2.3.3, for details). Upper right panel: distribution in Hα flux. Lower left panel: redshift distribution of those galaxies in the sample with zspec. Lower right panel: Hα luminosity vs. redshift for those galaxies in the sample with zspec. The solid line marks the luminosity for a galaxy with log FHα = −13.2 as reference.
Current usage metrics show cumulative count of Article Views (full-text article views including HTML views, PDF and ePub downloads, according to the available data) and Abstracts Views on Vision4Press platform.
Data correspond to usage on the plateform after 2015. The current usage metrics is available 48-96 hours after online publication and is updated daily on week days.
Initial download of the metrics may take a while.