Fig. 4.
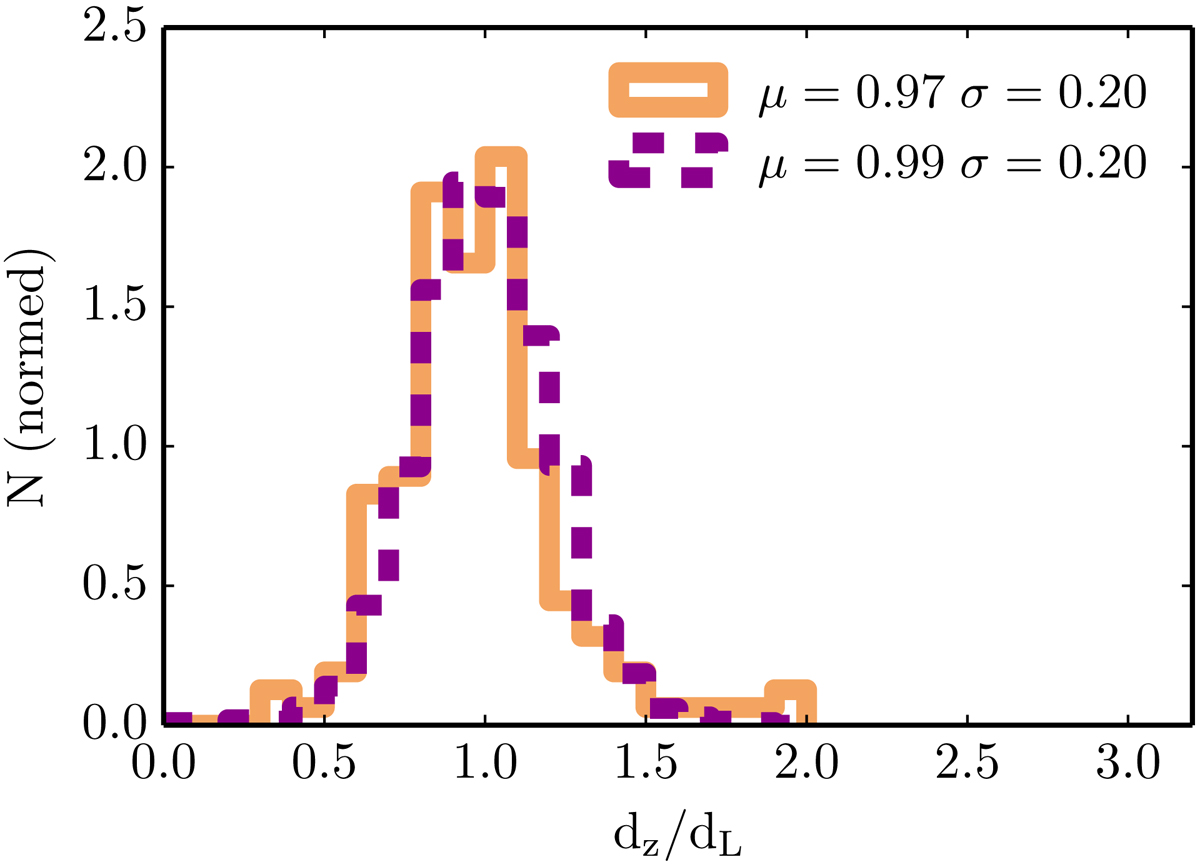
Histogram of the ratio between the redshift-derived (dz) and the redshift-independent (dL) luminosity distance for galaxies in Sample G2 (orange histogram). The purple histogram represents the same, but for a sample of simulated galaxies distributed according to a volume prior and with a spectroscopic redshift that has been perturbed with a peculiar velocity term of vpeculiar = 750 km s−1.
Current usage metrics show cumulative count of Article Views (full-text article views including HTML views, PDF and ePub downloads, according to the available data) and Abstracts Views on Vision4Press platform.
Data correspond to usage on the plateform after 2015. The current usage metrics is available 48-96 hours after online publication and is updated daily on week days.
Initial download of the metrics may take a while.