Fig. 2.
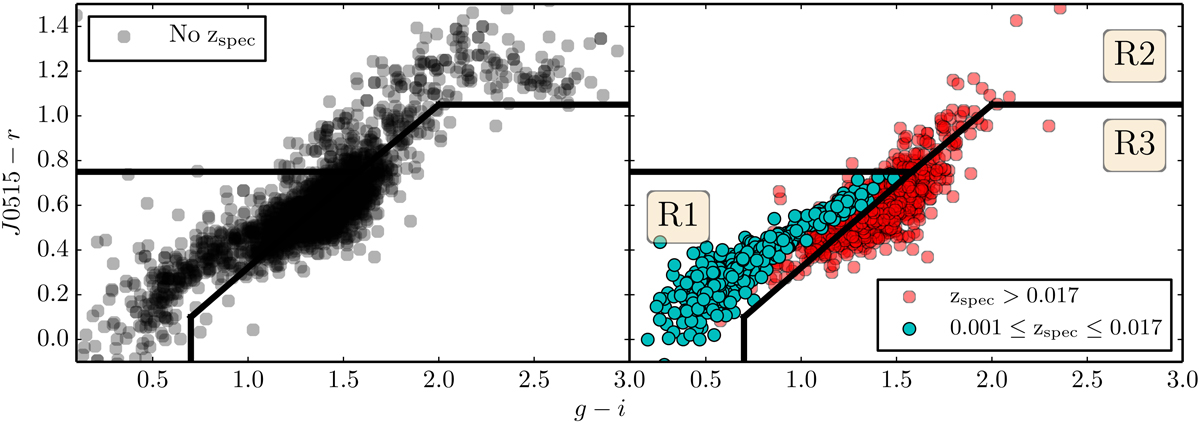
(J0515 − r) vs. (g − i) color–color diagram from ISO_GAUSS magnitudes of mr ≤ 18 sources with significant J0660 excess. Left panel: sources with no spectroscopic redshift in SDSS. Right panel: J0660 emitters, with spectroscopic redshift in SDSS. Cyan dots represent sources within our redshift of interest, while red dots are sources with higher redshift. The three regions defined to isolate low-z galaxies (R1), blended stars (R2), and high-z galaxies (R3) are labeled in the panel.
Current usage metrics show cumulative count of Article Views (full-text article views including HTML views, PDF and ePub downloads, according to the available data) and Abstracts Views on Vision4Press platform.
Data correspond to usage on the plateform after 2015. The current usage metrics is available 48-96 hours after online publication and is updated daily on week days.
Initial download of the metrics may take a while.