Fig. C.1.
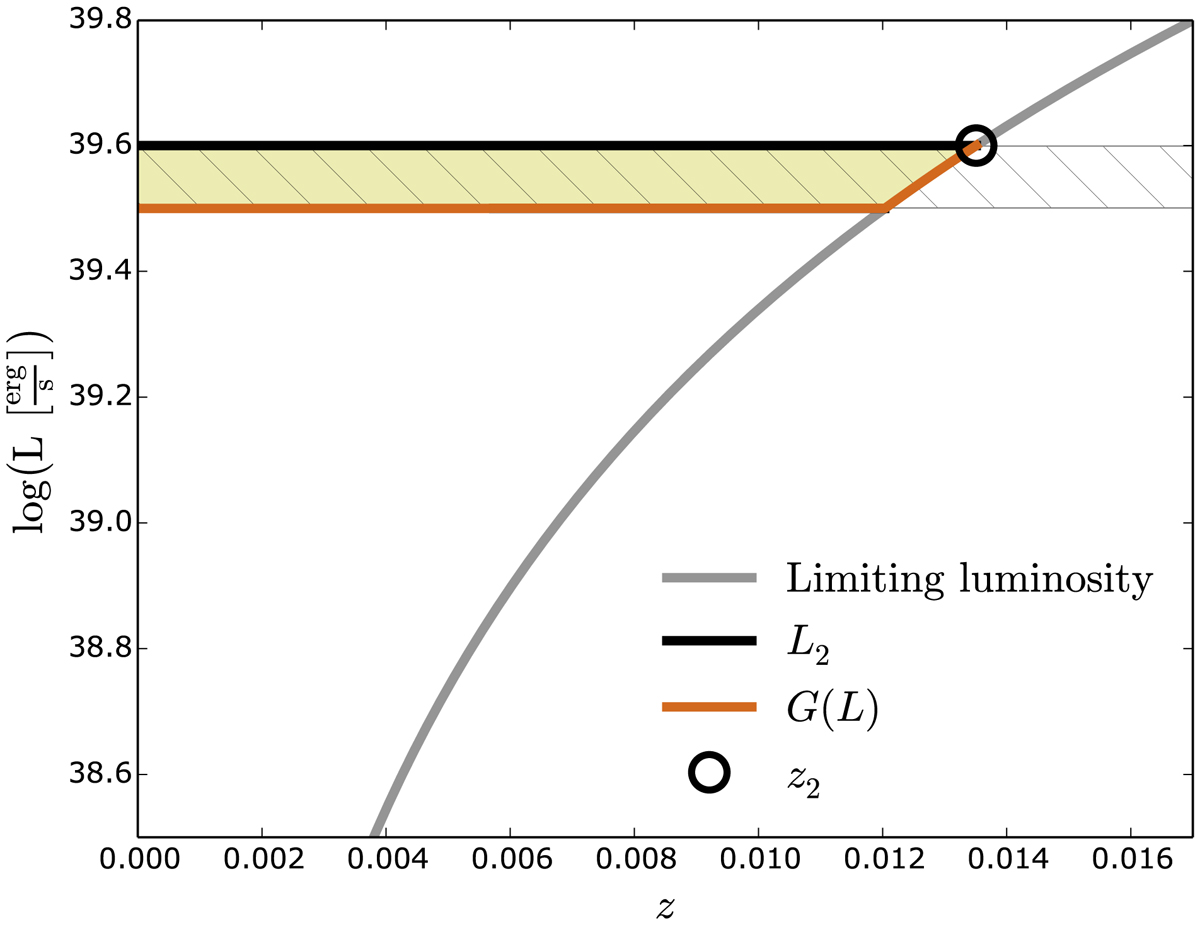
Luminosity associated to the limiting flux at each redshift. Solid curve: it represents the maximum luminosity that we are expected to see at each redshift. Yellow filled area: volume traced by all the galaxies that have a luminosity with a given luminosity bin, enclosed between L1 and L2 (horizontal solid lines). We refer to this volume as Vint Diagonally filled area: Total volume that would be traced without any limit in the minimum luminosity that we could observe. We refer to this as Vmax.
Current usage metrics show cumulative count of Article Views (full-text article views including HTML views, PDF and ePub downloads, according to the available data) and Abstracts Views on Vision4Press platform.
Data correspond to usage on the plateform after 2015. The current usage metrics is available 48-96 hours after online publication and is updated daily on week days.
Initial download of the metrics may take a while.