Free Access
Fig. 12.
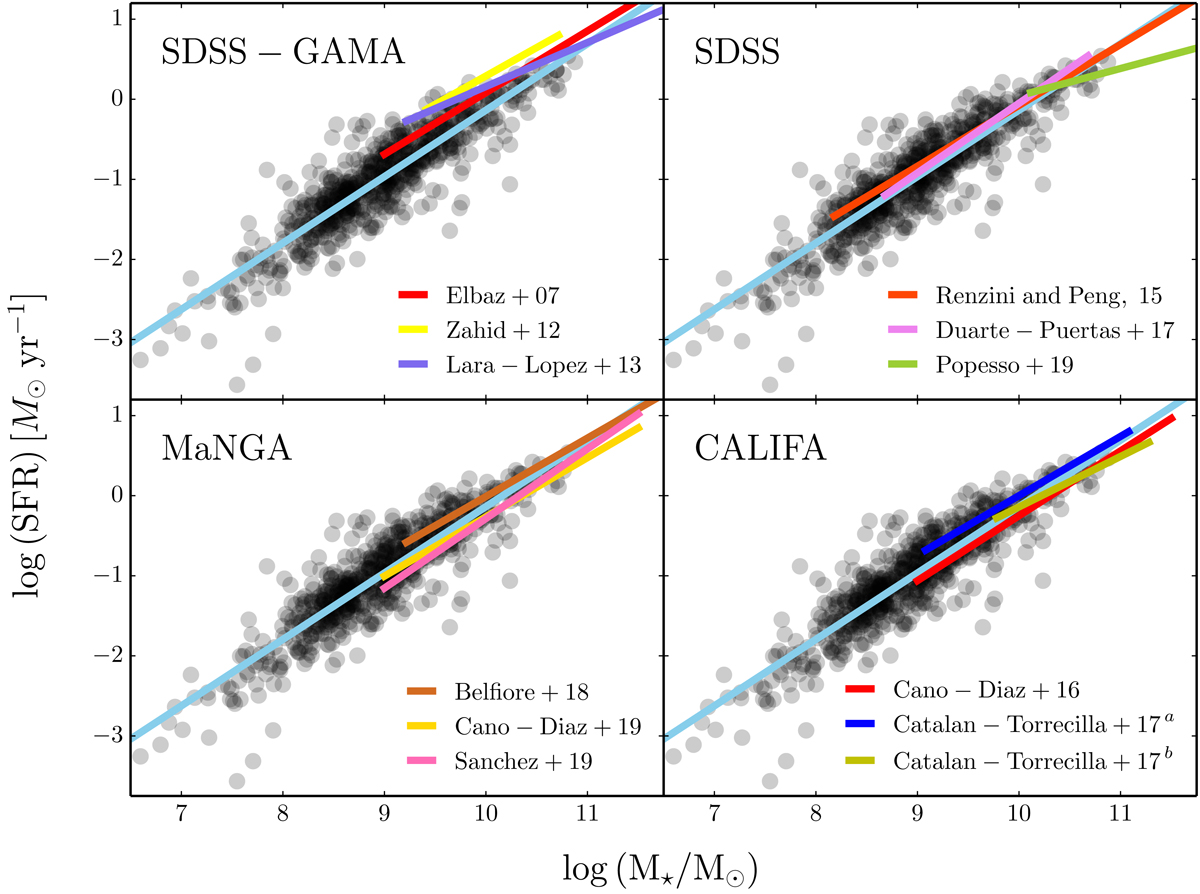
Star-formation main sequence in J-PLUS (bullets and cyan line) and in previous work in the literature. The source papers are labeled in the panels and summarized in Table. 2. The draw lines cover the stellar mass range spanned by each study.
Current usage metrics show cumulative count of Article Views (full-text article views including HTML views, PDF and ePub downloads, according to the available data) and Abstracts Views on Vision4Press platform.
Data correspond to usage on the plateform after 2015. The current usage metrics is available 48-96 hours after online publication and is updated daily on week days.
Initial download of the metrics may take a while.