Fig. 10.
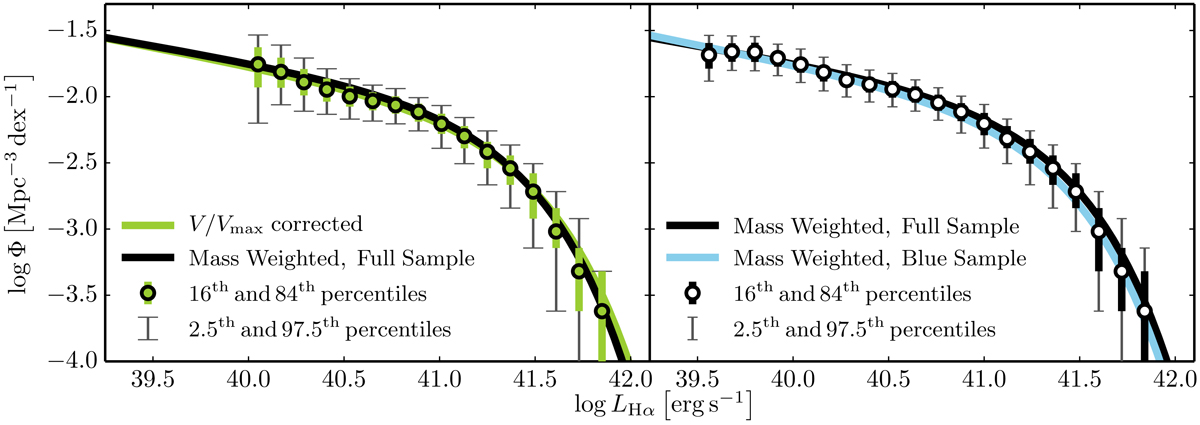
Hα luminosity functions estimated from J-PLUS DR1 at z ≤ 0.017. Left panel: HαLF estimated by the Vint/Vmax technique from the Full sample (green dots), accompanied with the best-fitting Schechter distribution to these data (green line). The black line in this plot uses the same data, but a different weighting technique based on the Stellar Mass Function. Right panel: empty dots are the HαLF estimated using only the Blue sample, together with the best-fitting Schechter distribution to these data, once weighted by their stellar mass (blue line). For comparison we show the best Schechter fitting using the mass-weighted Full sample (black line, in common with left panel black line). We see that neither the weighting criteria nor the sample have a major impact on the best-fitting distribution. However, the mass-weighted samples allow us to explore 0.5 dex the faint-end slope of the distribution.
Current usage metrics show cumulative count of Article Views (full-text article views including HTML views, PDF and ePub downloads, according to the available data) and Abstracts Views on Vision4Press platform.
Data correspond to usage on the plateform after 2015. The current usage metrics is available 48-96 hours after online publication and is updated daily on week days.
Initial download of the metrics may take a while.