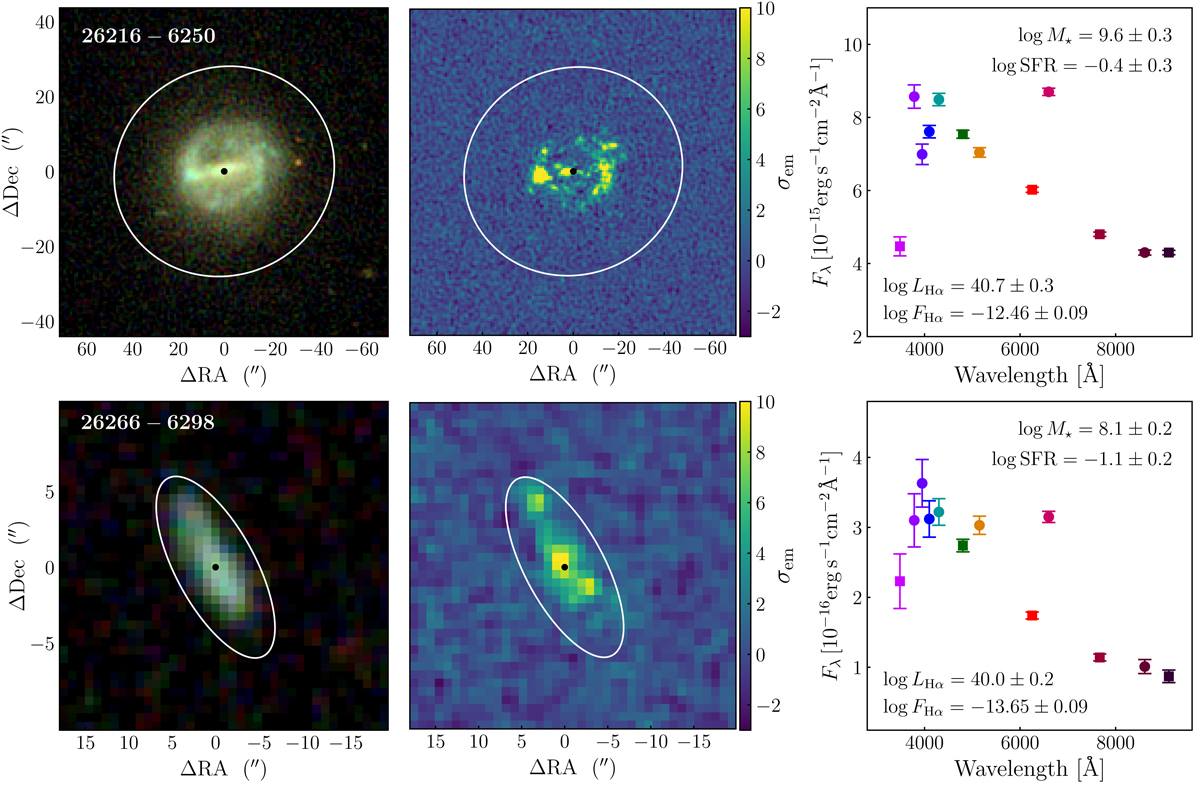
Fig. 1.
Illustrative examples of the J-PLUS DR1 sample of local galaxies, presenting sources 26216-6250 (RA = 227.1397, Dec = 52.2960; UGC 9741 at zspec = 0.0083) and 26266-6298 (RA = 231.1995, Dec = 55.1277; there is no spectroscopic redshift for this source in the analyzed databases, see Sect. 2.2.2). The sky location of the sources is marked with a bullet in the left and central panels, and the white ellipse marks the three effective radii contour for the sources. Left panels: color composite of the galaxies, obtained from the gri J-PLUS images. Central panels: J0660 emission in units of σem, the dispersion of the pixels in the image (Sect. 2.3.1), as scaled in the color bar. This emission image has been obtained by applying the 3F methodology in VR15 to the r, J0660, and i J-PLUS images. Several star-forming knots are apparent. Right panels: J-PLUS twelve-band photometry (the SED) of those pixels with J0660 emission larger than σem (Sect. 2.3.1) and inside three effective radii. Squares show the five SDSS-like filters (ugriz), and circles the seven medium- and narrow-band filters (J0378, J0395, J0410, J0430, J0515, J0660, and J0861). The flux in J0660, J0515, and J0378 is raised with respect to the continuum level due to the Hα + [N II], [O III], and [O II] emission, respectively. The derived physical properties of the galaxies (Sects. 2.3.2 and 2.3.4) are labeled in the panels.
Current usage metrics show cumulative count of Article Views (full-text article views including HTML views, PDF and ePub downloads, according to the available data) and Abstracts Views on Vision4Press platform.
Data correspond to usage on the plateform after 2015. The current usage metrics is available 48-96 hours after online publication and is updated daily on week days.
Initial download of the metrics may take a while.