Fig. 9.
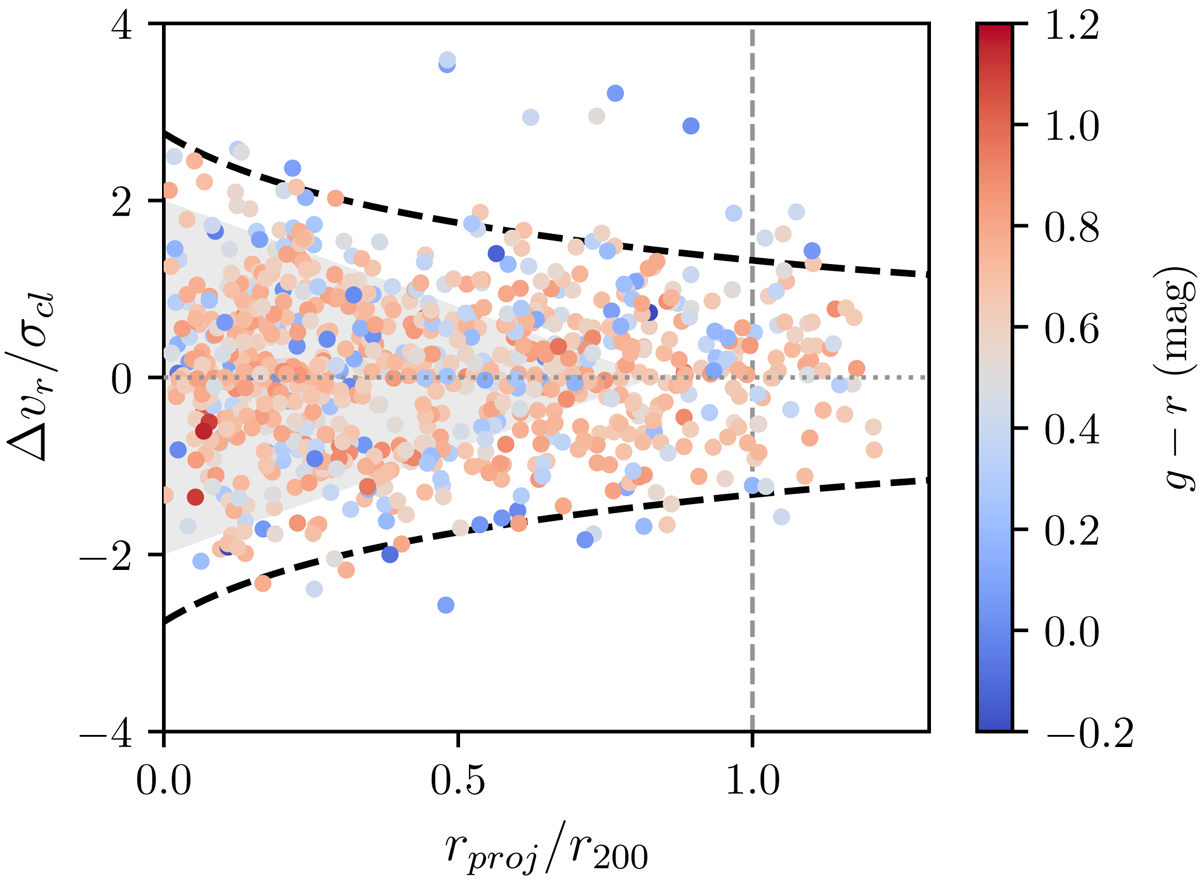
Phase-space diagram for Coma. The black dashed lines represent the escape velocity for Coma, calculated using a concentration index (c) of 5, M200 = 5.1 × 10¹⁴ M⊙ and r200 = 1.8 Mpc (Gavazzi et al. 2009). Galaxies inside the escape velocity ‘trumpet’ are considered to be within the cluster, while galaxies on the outside edge of the trumpet are considered to be falling into the cluster. The light grey shaded cone represents the virialised zone (Oman et al. 2013). The g − r colour of each galaxy is given by the colour scale in colourbar.
Current usage metrics show cumulative count of Article Views (full-text article views including HTML views, PDF and ePub downloads, according to the available data) and Abstracts Views on Vision4Press platform.
Data correspond to usage on the plateform after 2015. The current usage metrics is available 48-96 hours after online publication and is updated daily on week days.
Initial download of the metrics may take a while.