Fig. 8.
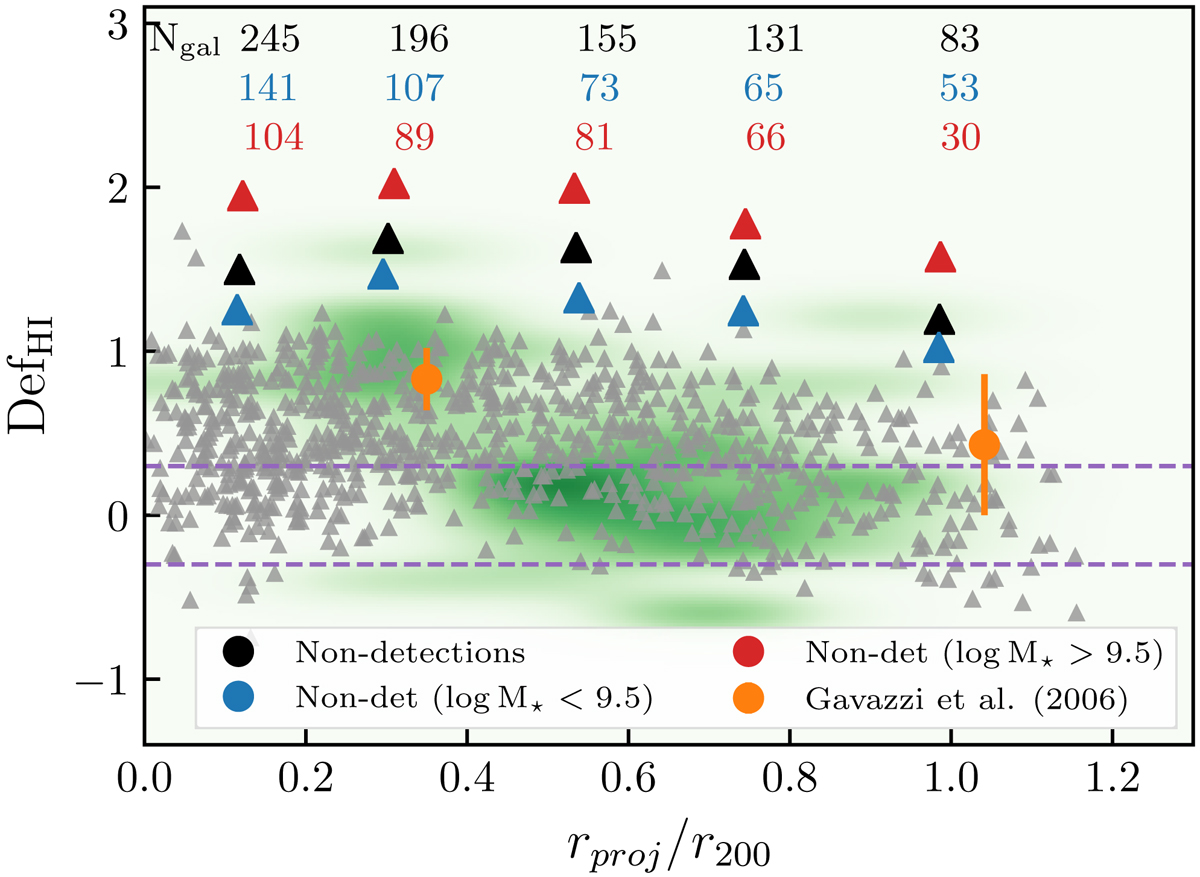
H I deficiency of the Coma galaxies as a function of projected radius from the cluster centre. The individual H I deficiency measurements for the Coma galaxies are represented by the green shaded distribution for the H I detections and grey triangles for the lower limits on the H I non-detections. The average H I deficiencies for late-type Coma galaxies from Gavazzi et al. (2006) are shown in orange. The black, blue, and red triangles represent the lower limits from stacking the non-detections in annuli in three samples: all non-detections, log M⋆ < 9.5, and log M⋆ > 9.5, respectively. The horizontal dashed purple lines set the limit on DEFH I values that indicate a galaxy is H I-normal.
Current usage metrics show cumulative count of Article Views (full-text article views including HTML views, PDF and ePub downloads, according to the available data) and Abstracts Views on Vision4Press platform.
Data correspond to usage on the plateform after 2015. The current usage metrics is available 48-96 hours after online publication and is updated daily on week days.
Initial download of the metrics may take a while.