Fig. 7.
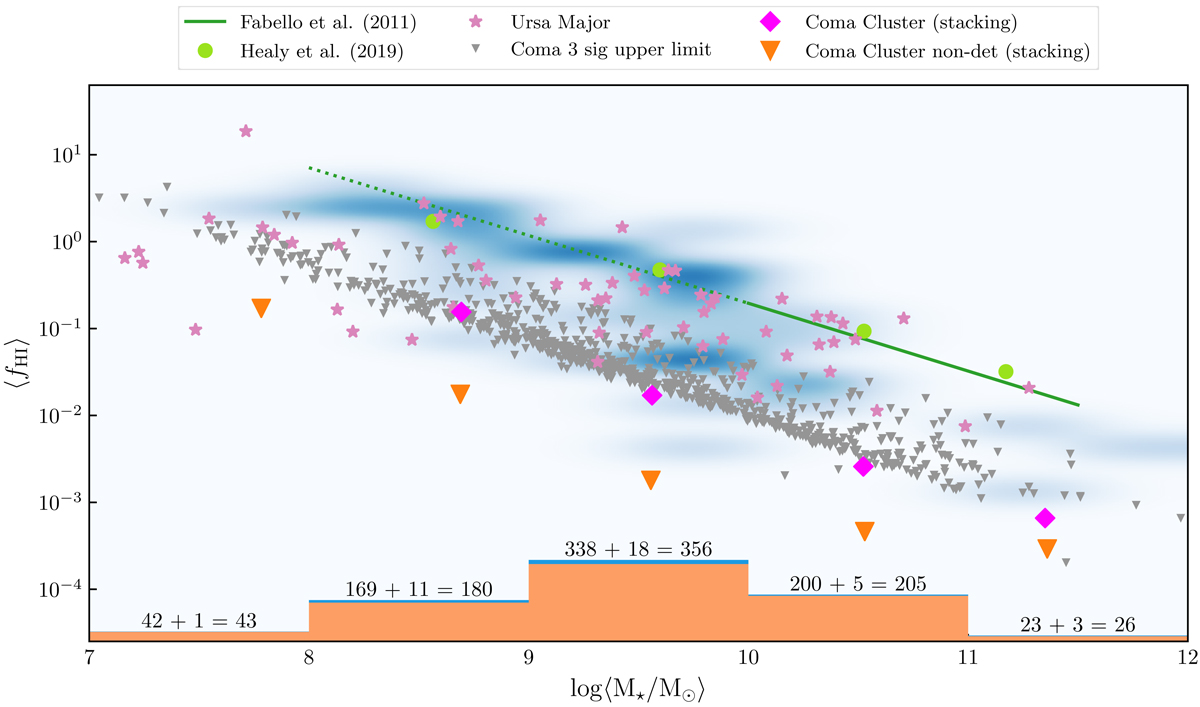
Stellar mass (M⋆) to H I gas fraction (fH I) scaling relation for the Coma cluster. The individual 3σ upper limits for the Coma H I non-detections are represented by the grey down-pointing triangles, while the distribution of the individual H I detections is shown by the blue density plot. The pink diamond and orange down-pointing triangle symbols represent the stacking of all Coma galaxies and only non-detections, respectively. The pink diamonds show measurements from a detected stacked spectrum, and the orange triangles indicate the 3σ upper limit in the case of a non-detection in the stacked spectrum. The round light green symbols and green line represent the stacking of field galaxies by Healy et al. (2019) and Fabello et al. (2011), respectively; the dashed green line is an extrapolation of the Fabello et al. (2011) results. The individual fH I measurements (pink stars) for galaxies in the Ursa Major cluster are also shown for reference (Verheijen & Sancisi 2001).
Current usage metrics show cumulative count of Article Views (full-text article views including HTML views, PDF and ePub downloads, according to the available data) and Abstracts Views on Vision4Press platform.
Data correspond to usage on the plateform after 2015. The current usage metrics is available 48-96 hours after online publication and is updated daily on week days.
Initial download of the metrics may take a while.