Fig. 6.
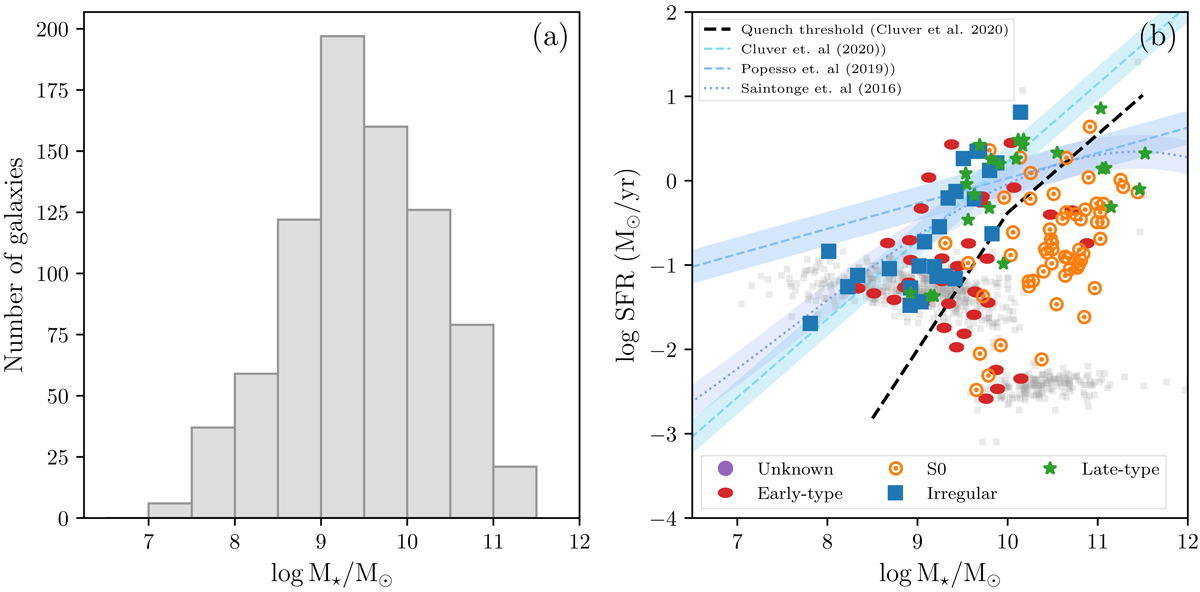
Stellar mass and star formation distribution of Coma galaxies in the WCS footprint. Left: stellar mass distribution of Coma galaxies within the WCS footprint. Right: star formation rate as a function of stellar mass for the Coma galaxies. The 2σ upper limit on the star formation is shown for galaxies for which there is no detection in the W3 band; these are represented by the light grey points. The step function in the upper limits arises owing to a non-detection in W3 for low-mass galaxies and a non-detection after continuum subtraction in W3 for high-mass galaxies. Also shown for reference are fits to the star formation main sequence by Cluver et al. (2020), Popesso et al. (2019) and Saintonge et al. (2016). The black dashed line indicates the quench threshold (Cluver et al. 2020) below which galaxies are not considered to be actively star forming.
Current usage metrics show cumulative count of Article Views (full-text article views including HTML views, PDF and ePub downloads, according to the available data) and Abstracts Views on Vision4Press platform.
Data correspond to usage on the plateform after 2015. The current usage metrics is available 48-96 hours after online publication and is updated daily on week days.
Initial download of the metrics may take a while.