Free Access
Fig. 5.
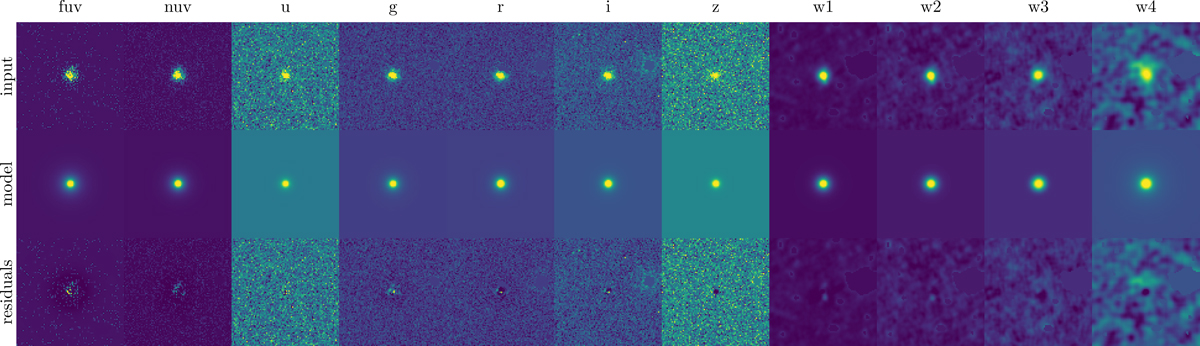
Galaxy modelled with a single Sersic profile by GALFITM. The input data are shown in the top row, the model in the second row, and the residuals in the bottom row. The colour scale is set in every column such that each row has the same intensity.
Current usage metrics show cumulative count of Article Views (full-text article views including HTML views, PDF and ePub downloads, according to the available data) and Abstracts Views on Vision4Press platform.
Data correspond to usage on the plateform after 2015. The current usage metrics is available 48-96 hours after online publication and is updated daily on week days.
Initial download of the metrics may take a while.