Fig. 3.
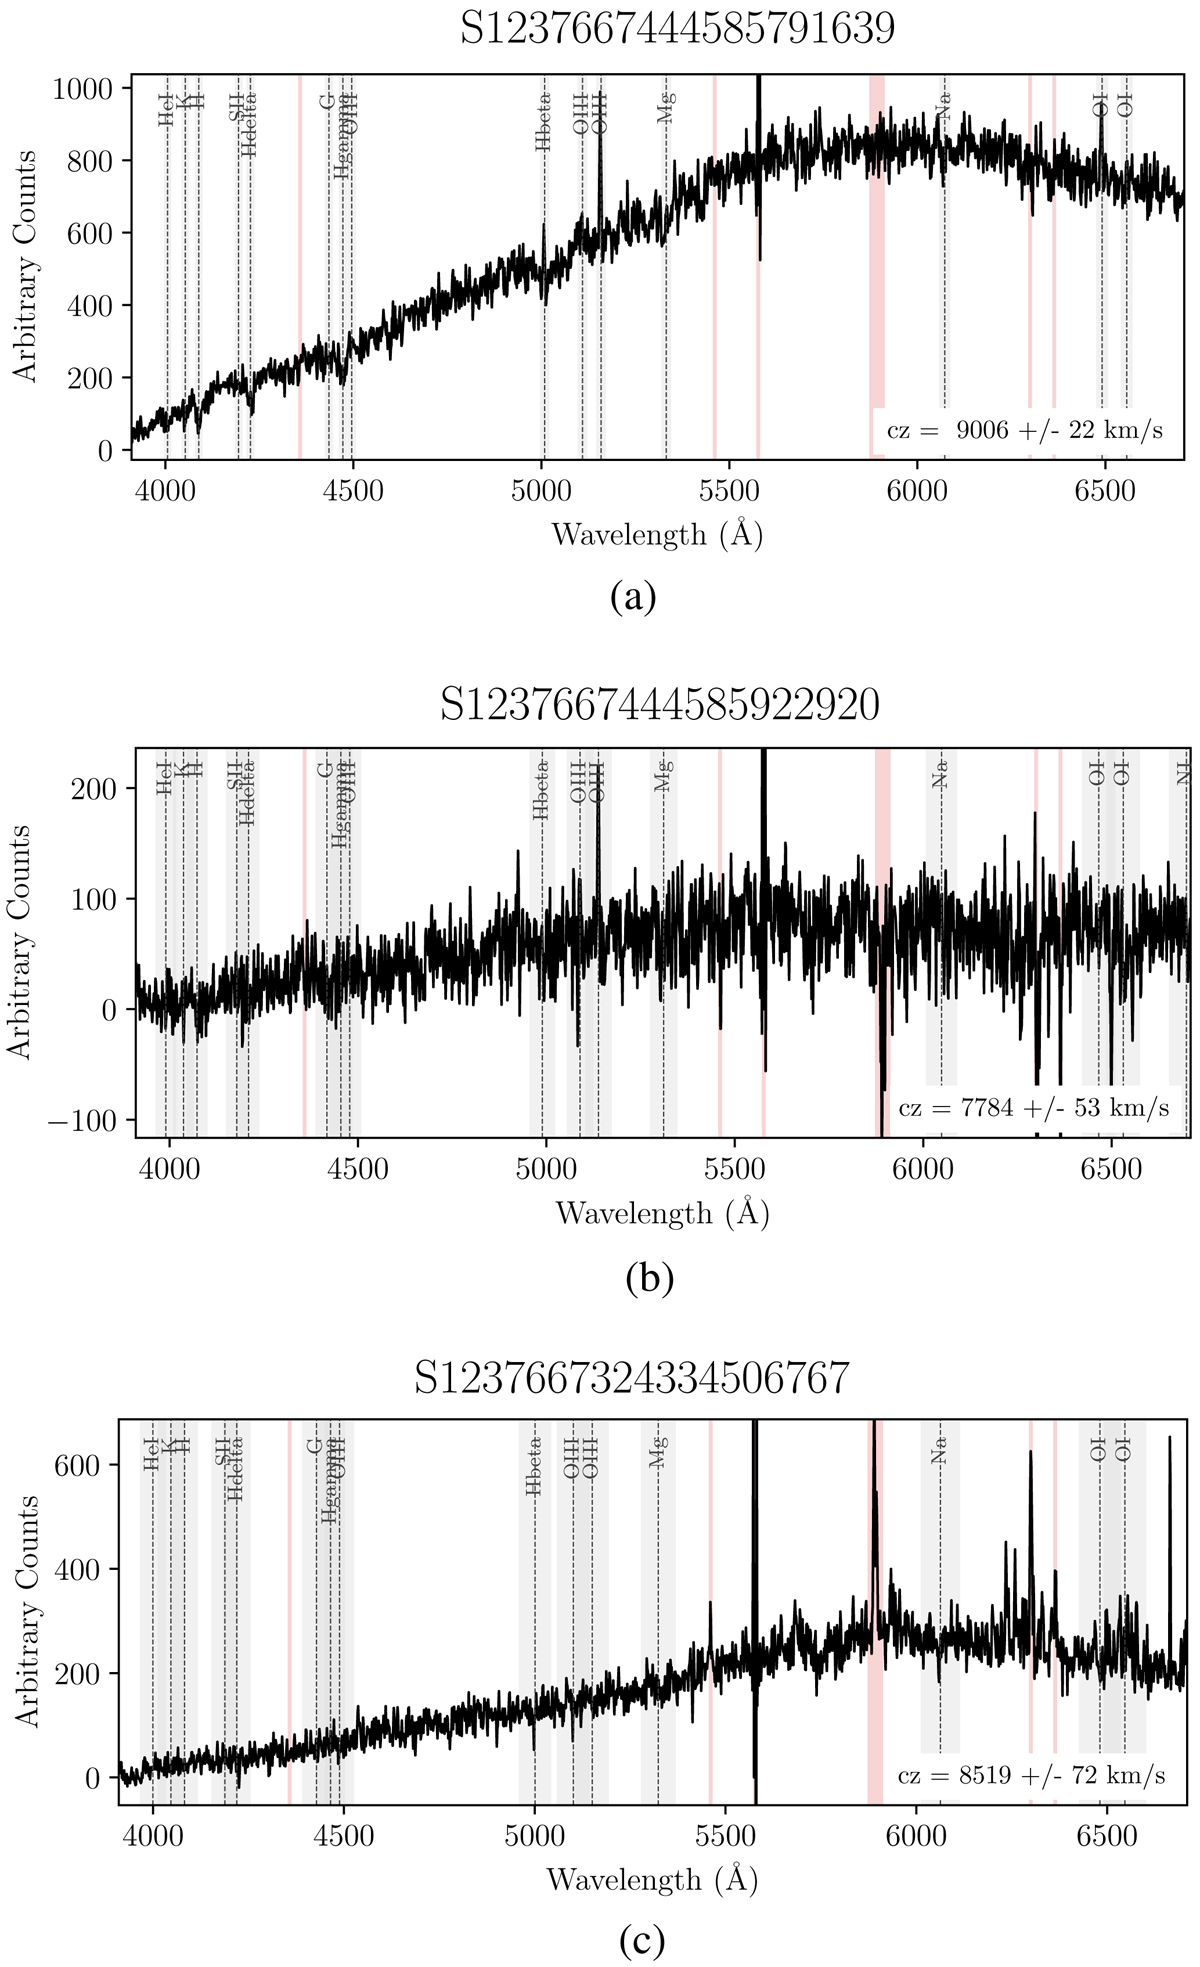
Three examples of the cross-correlation results of Hydra spectra. The dashed lines and grey regions indicate the central wavelength and associated error of the labelled line. The red regions indicate those masked out during the cross-correlation process because of strong sky lines. (a) Good spectrum. (b) Low signal-to-noise. (c) Poor sky subtraction.
Current usage metrics show cumulative count of Article Views (full-text article views including HTML views, PDF and ePub downloads, according to the available data) and Abstracts Views on Vision4Press platform.
Data correspond to usage on the plateform after 2015. The current usage metrics is available 48-96 hours after online publication and is updated daily on week days.
Initial download of the metrics may take a while.