Fig. 2.
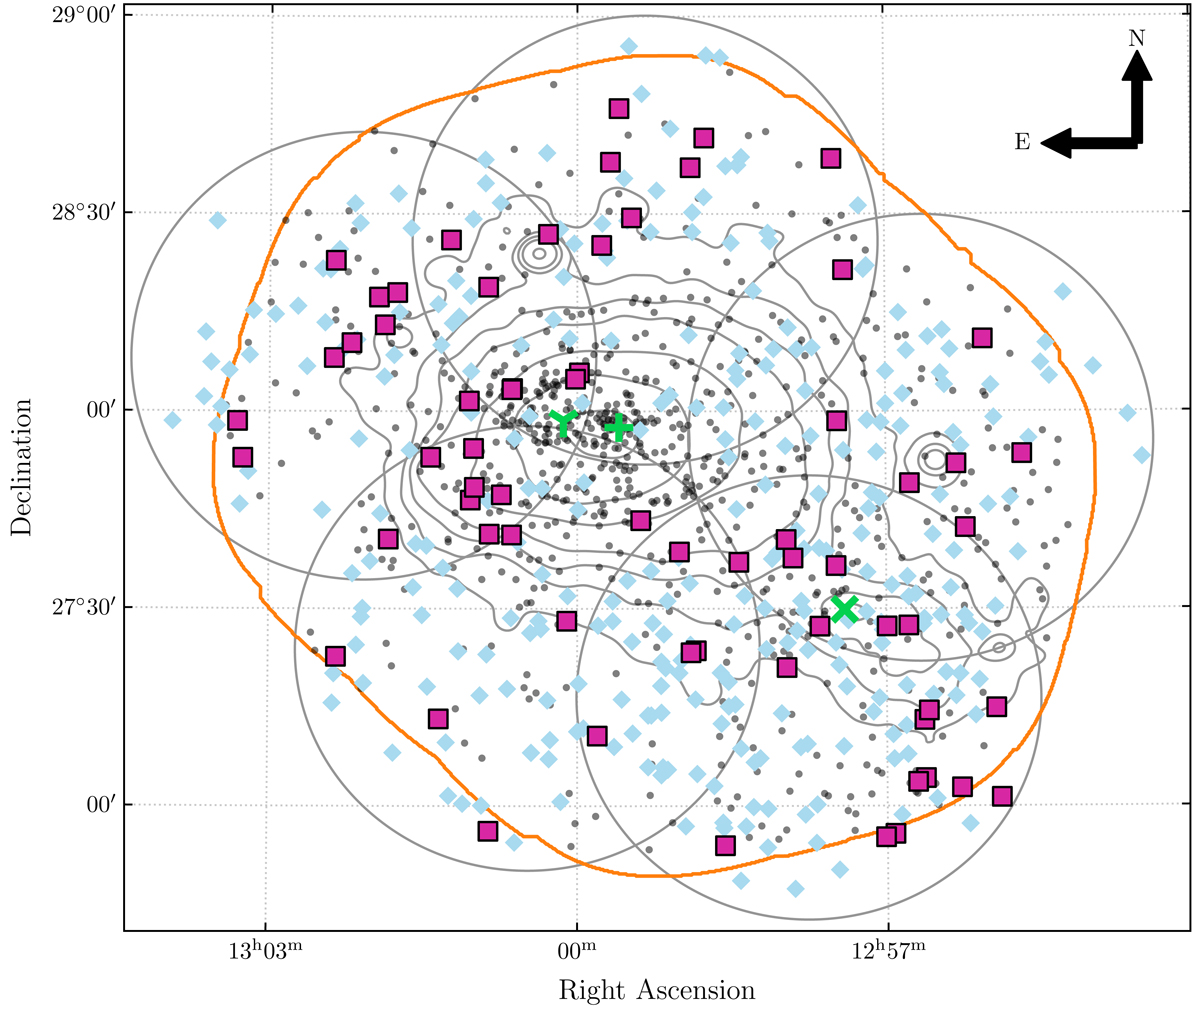
WIYN/Hydra targets, and observed sources. The 5 fields (3 of the fields had a second configuration) targeted with WIYN are indicated by the large circles. The square and diamond data points represent the galaxies we targeted with Hydra. The galaxies with redshifts in the Coma volume are represented by the magenta square data points and the foreground and background galaxies are represented by the blue diamond markers. The green markers represent the three cD galaxies in Coma (+–NGC 4874, ⋎–NGC 4889 and ×–NGC 4839). The 0.4−2.4 keV ROSAT X-ray contours are given by the grey contours (outer contours correspond to 3 × 10⁻⁵ cts s−1, and inner-most contours to 1 × 10⁻³ cts s−1). Other confirmed members of the Coma cluster are represented by the small grey circles. The WCS footprint is indicated by the orange outline.
Current usage metrics show cumulative count of Article Views (full-text article views including HTML views, PDF and ePub downloads, according to the available data) and Abstracts Views on Vision4Press platform.
Data correspond to usage on the plateform after 2015. The current usage metrics is available 48-96 hours after online publication and is updated daily on week days.
Initial download of the metrics may take a while.