Fig. B.3.
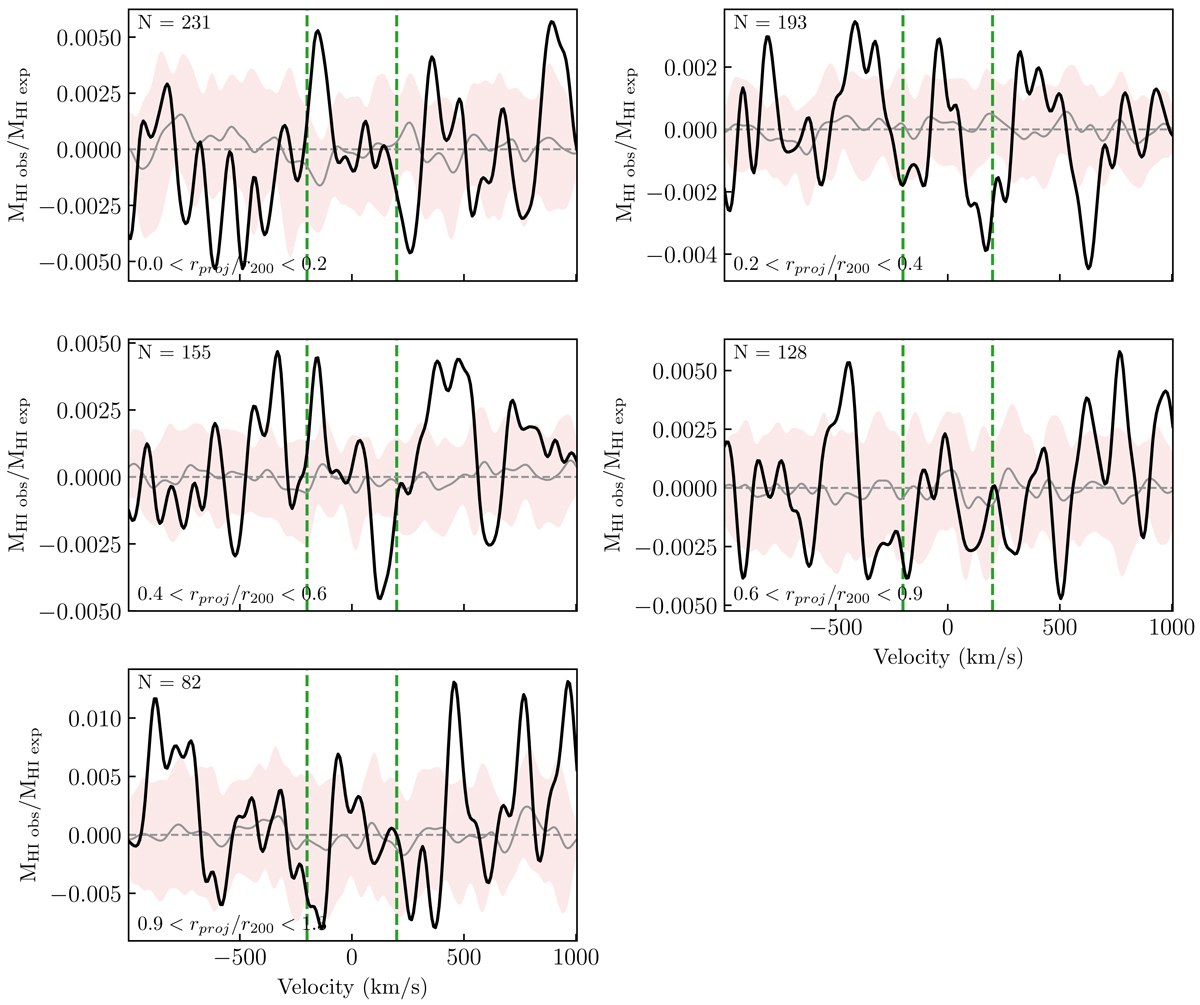
Coma non-detections stacked in annuli with increasing radius from the cluster centre. The stacked spectra (the black line) have been smoothed to a velocity resolution of 80 km s−1. The orange band represents the 1σ distribution from 25 stacked reference spectra. The vertical dashed green lines indicate the range over which the spectra are integrated to determine the average integrated flux density for each sample. Each panel represents a different stellar mass bin. The number of spectra in each bin are given in the top left corner of each panel. These spectra are used to determine the average DEFH I (DEFH I = log MH I,exp − log MH I,obs) in Fig. 8.
Current usage metrics show cumulative count of Article Views (full-text article views including HTML views, PDF and ePub downloads, according to the available data) and Abstracts Views on Vision4Press platform.
Data correspond to usage on the plateform after 2015. The current usage metrics is available 48-96 hours after online publication and is updated daily on week days.
Initial download of the metrics may take a while.