Fig. A.2.
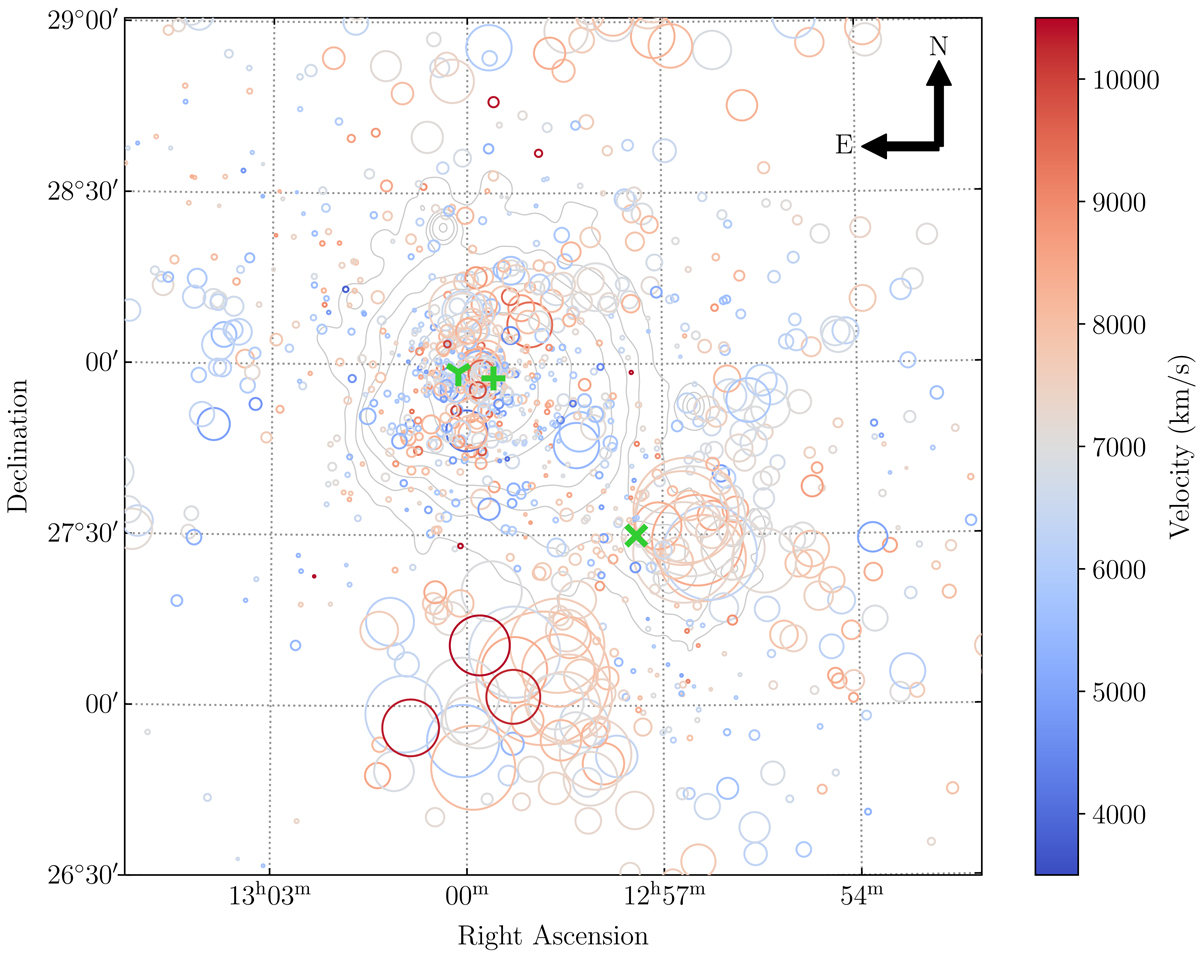
Bubble plot showing the results of the DS test for the Coma cluster. The δ values are a result of using the 25 nearest neighbours. The red and blue colours indicate the recessional velocity (cz) of each galaxy. The green markers represent the three cD galaxies in Coma (+–NGC 4874, ⋎–NGC 4889 and ×–NGC 4839). The background grey contours represent the X-ray emission measured by ROSAT in 0.4−2.4 keV.
Current usage metrics show cumulative count of Article Views (full-text article views including HTML views, PDF and ePub downloads, according to the available data) and Abstracts Views on Vision4Press platform.
Data correspond to usage on the plateform after 2015. The current usage metrics is available 48-96 hours after online publication and is updated daily on week days.
Initial download of the metrics may take a while.