Fig. A.1.
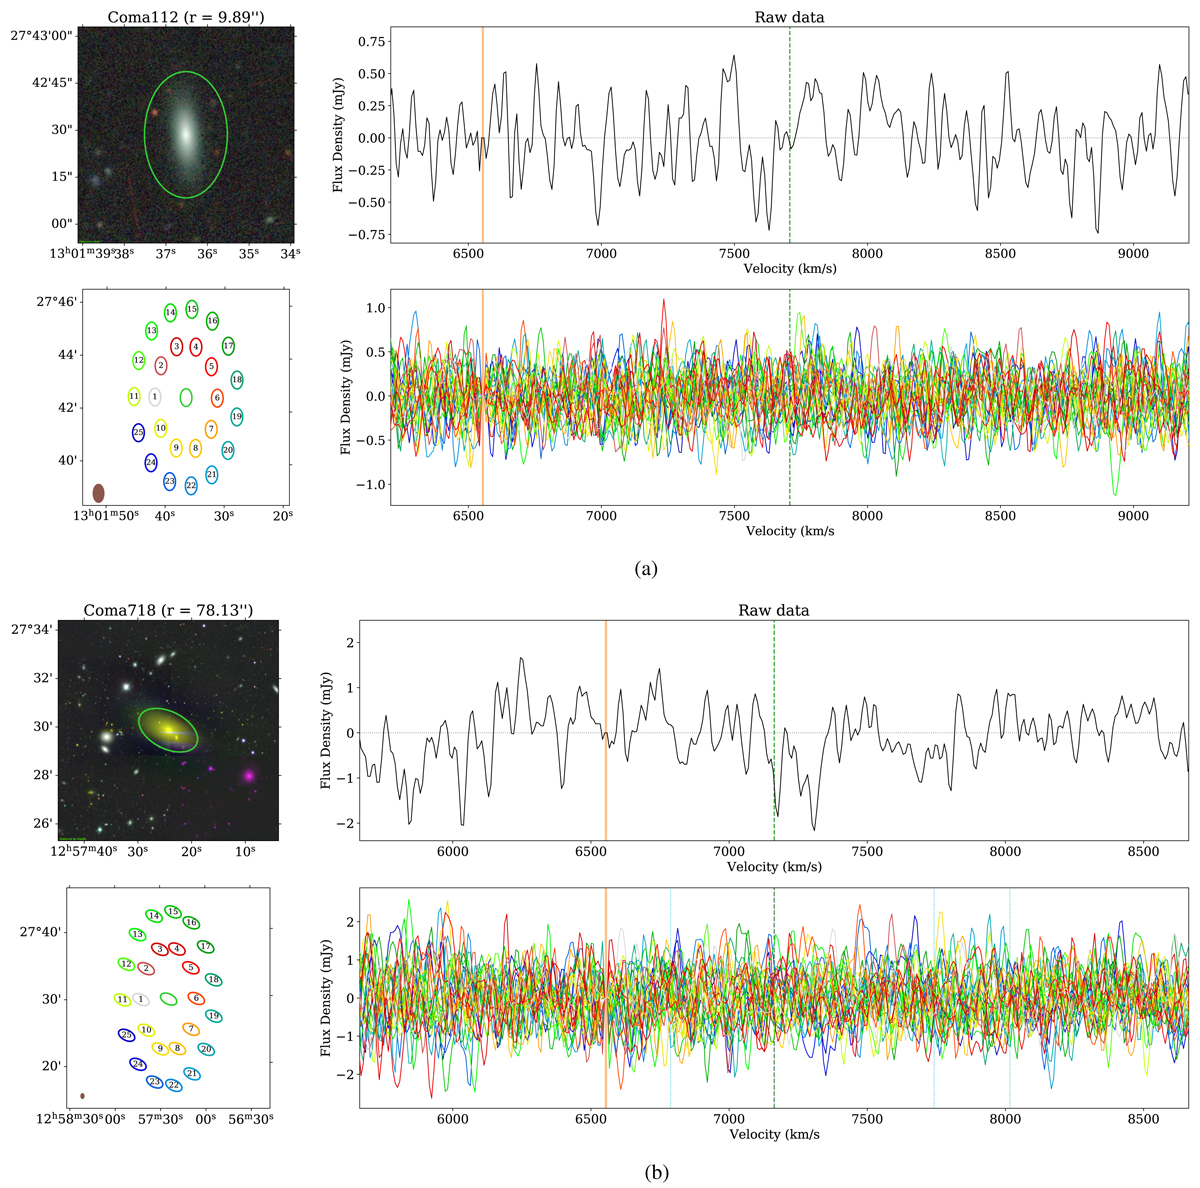
Method used to extract the 1D H I spectra is presented in the figures above. (a) presents a galaxy that is unresolved by the WRST beam, and (b) a galaxy that is resolved by the beam. A colour cut-out of the galaxy with the extraction aperture overlaid in green is shown in the top left panel. Bottom left panel: location of the 25 reference spectra relative to the target spectrum. Middle top panel: target spectrum, and the middle bottom panel shows the 25 reference spectra. In both middle panels, the vertical dashed green line indicates the redshift of the target galaxy; the orange band represents the gap between the two frequency bands. (a) Source unresolved by the WRST beam. (b) Source resolved by the WRST beam.
Current usage metrics show cumulative count of Article Views (full-text article views including HTML views, PDF and ePub downloads, according to the available data) and Abstracts Views on Vision4Press platform.
Data correspond to usage on the plateform after 2015. The current usage metrics is available 48-96 hours after online publication and is updated daily on week days.
Initial download of the metrics may take a while.