Fig. 13.
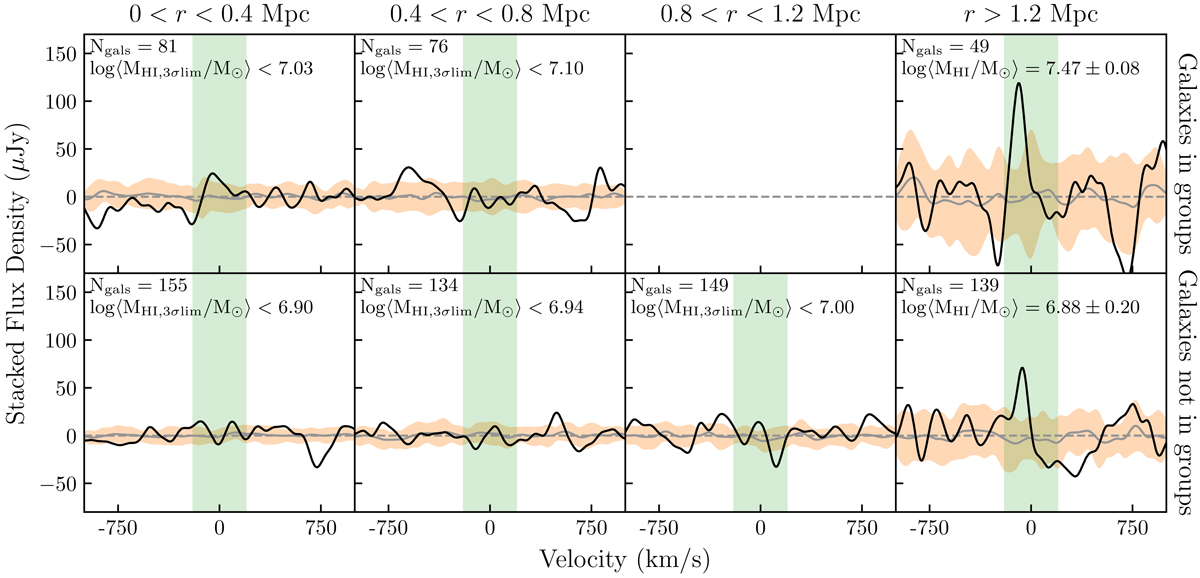
Stacked spectra for galaxies in groups (top row), and galaxies not in groups (bottom row) separated into different annuli from the cluster centre. The average stacked spectrum in each panel is indicated by a solid black line. The average stacked reference spectrum is represented by a solid grey line, with the variance of 25 stacked reference spectra surrounding the average reference spectrum in orange. The green band is the velocity range cz ± 200 km s−1 over which the H I emission is expected to be seen.
Current usage metrics show cumulative count of Article Views (full-text article views including HTML views, PDF and ePub downloads, according to the available data) and Abstracts Views on Vision4Press platform.
Data correspond to usage on the plateform after 2015. The current usage metrics is available 48-96 hours after online publication and is updated daily on week days.
Initial download of the metrics may take a while.