Fig. 11.
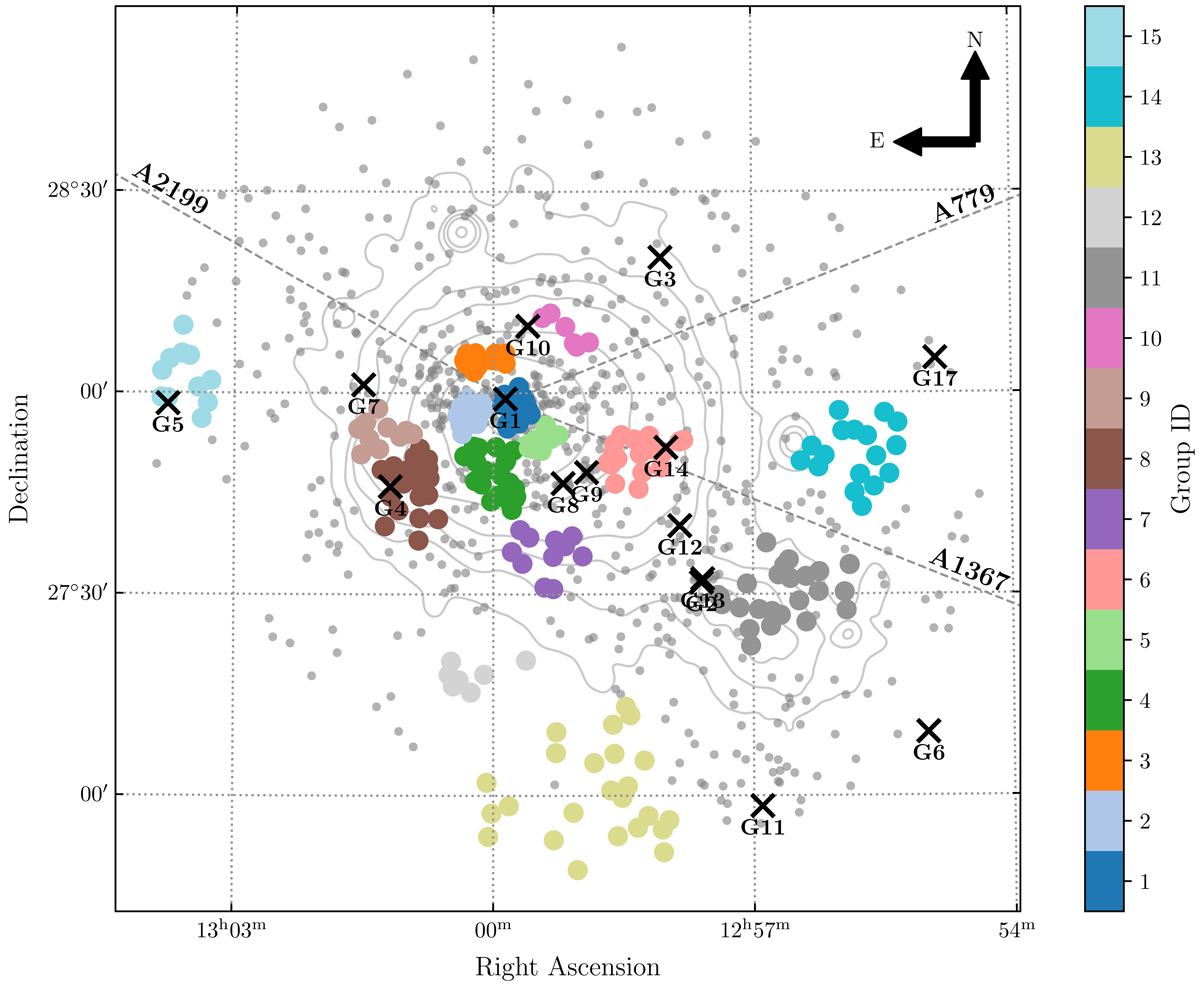
Substructure in the WCS footprint. The 15 identified groups are shown in different colours. The background grey contours represent the X-ray emission measured by ROSAT in 0.4−2.4 keV. The dashed grey lines indicate the direction to nearby clusters connected to Coma. The groups identified by Adami et al. (2005) are labelled and denoted by black crosses.
Current usage metrics show cumulative count of Article Views (full-text article views including HTML views, PDF and ePub downloads, according to the available data) and Abstracts Views on Vision4Press platform.
Data correspond to usage on the plateform after 2015. The current usage metrics is available 48-96 hours after online publication and is updated daily on week days.
Initial download of the metrics may take a while.