Fig. 2.
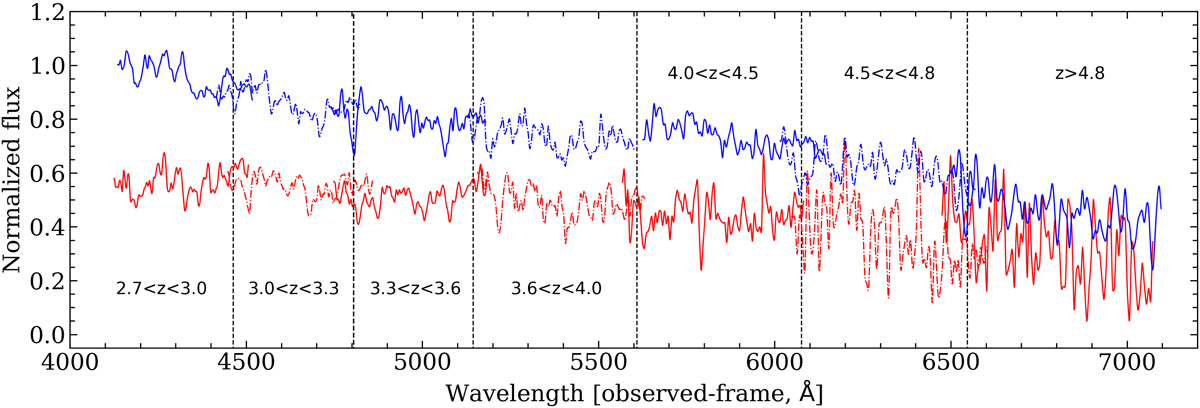
Evolution of the region in which the Lyα transmission is computed (1070–1170 Å) in the different redshift bins of Fig. 1, but this time in the observed frame (the redshifts of the spectra are set to the average redshift of the redshift bin). The vertical dashed lines show the separation between each redshift bin (in the middle of the overlap). The color-coding is the same as in Fig. 1.
Current usage metrics show cumulative count of Article Views (full-text article views including HTML views, PDF and ePub downloads, according to the available data) and Abstracts Views on Vision4Press platform.
Data correspond to usage on the plateform after 2015. The current usage metrics is available 48-96 hours after online publication and is updated daily on week days.
Initial download of the metrics may take a while.