Fig. 6.
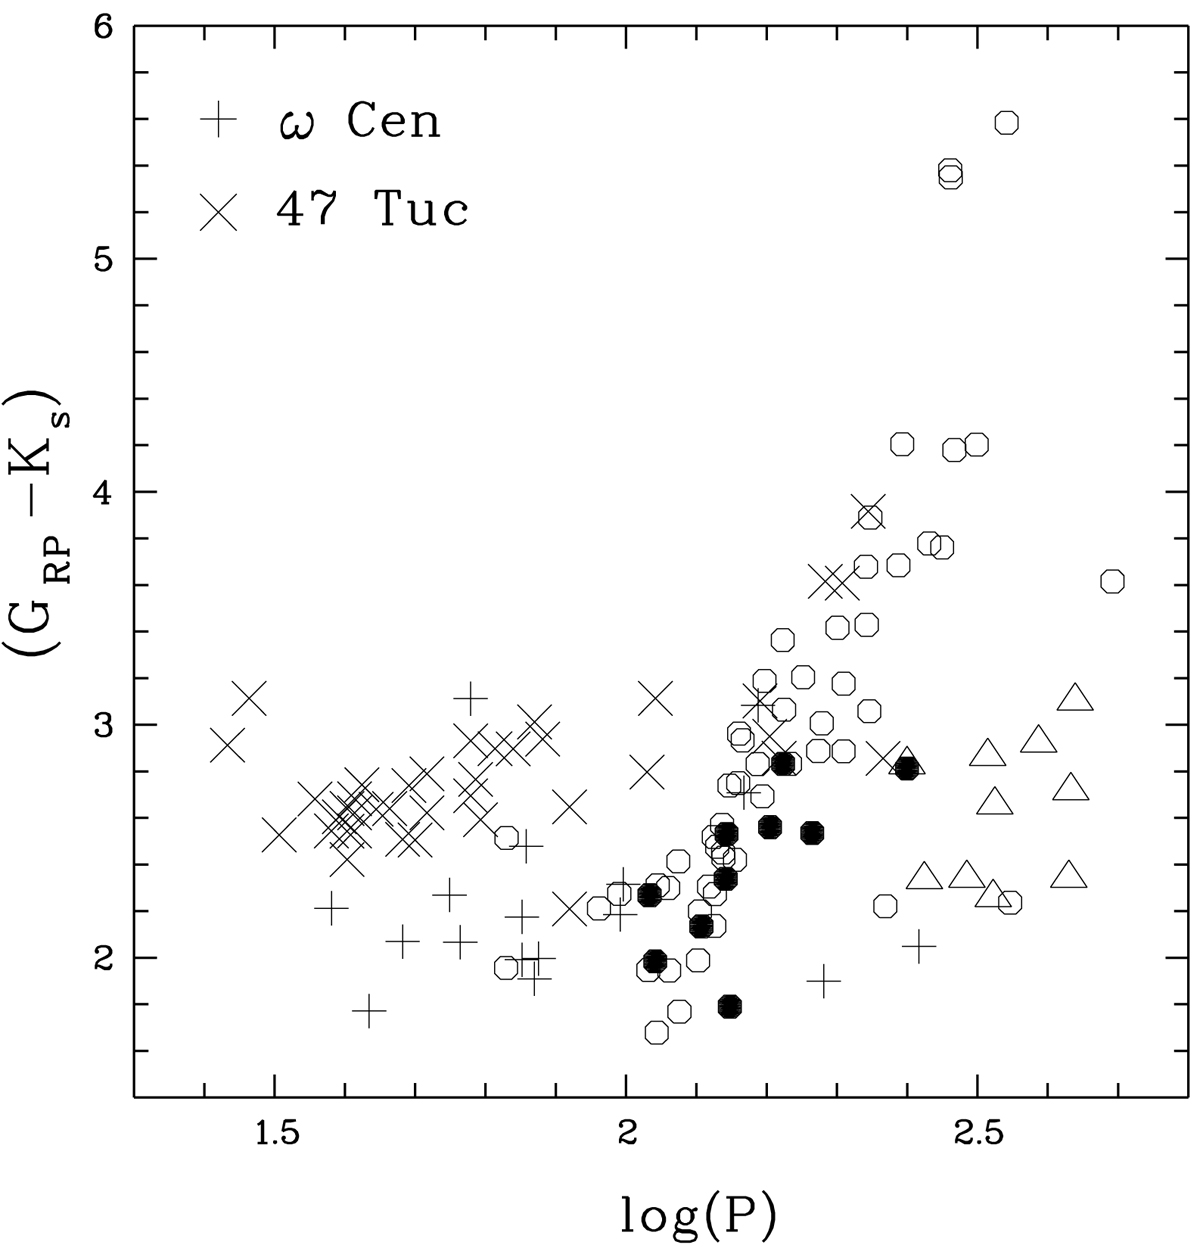
Colour (GRP − Ks), corrected for interstellar extinction, plotted as a function of pulsation period. Circles represent the M-type LPVs of our sample. Triangles are the large-period small-amplitude group in our sample seen in Fig. 2. Filled circles are the discovered distant LPVs listed in Table 3. The LPVs of the globular clusters ω Cen ([Fe/H] = −1.6) and 47 Tuc ([Fe/H] = −0.70) are shown for comparison, and are indicated by plus signs and crosses, respectively. Note that a few GC LPVs with log(P) > 2.1 are located along the rising red main group. Uncertainties are comparable to symbol size.
Current usage metrics show cumulative count of Article Views (full-text article views including HTML views, PDF and ePub downloads, according to the available data) and Abstracts Views on Vision4Press platform.
Data correspond to usage on the plateform after 2015. The current usage metrics is available 48-96 hours after online publication and is updated daily on week days.
Initial download of the metrics may take a while.