Fig. 4.
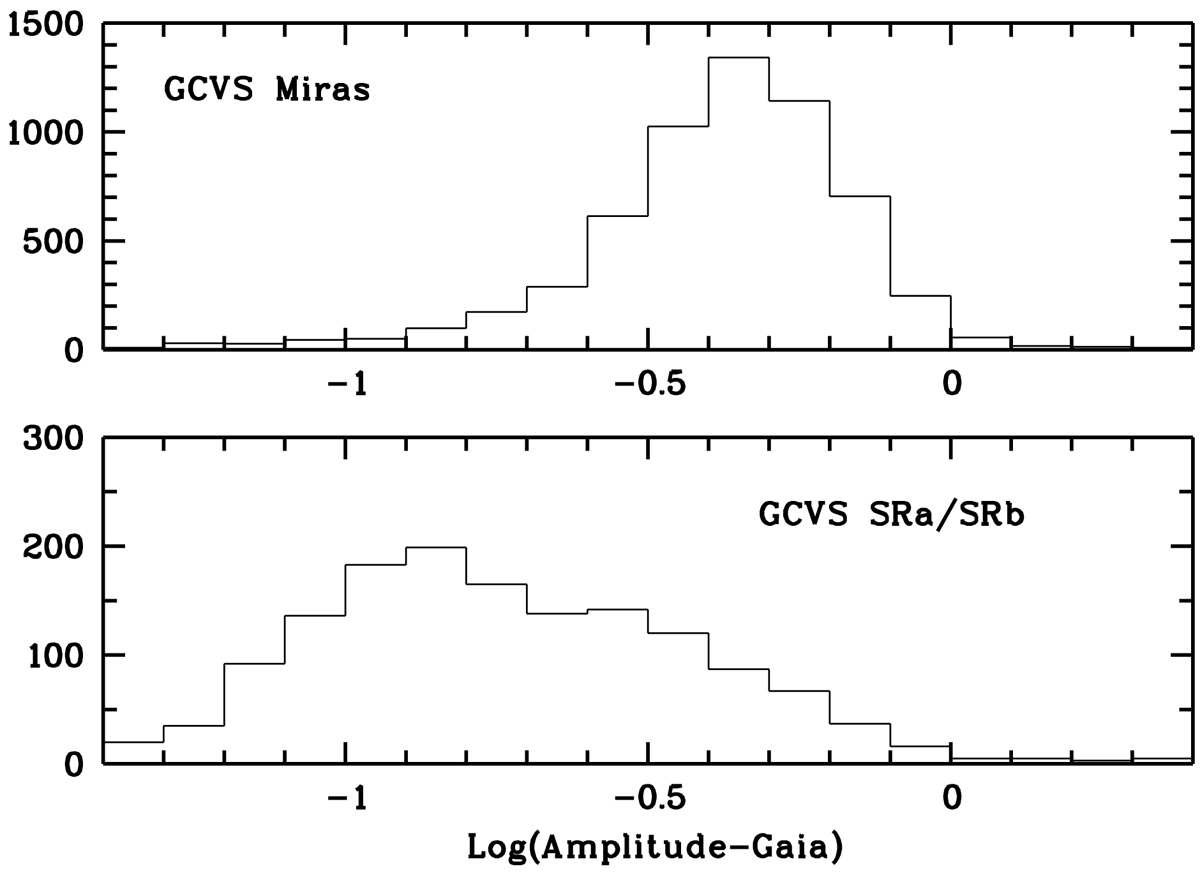
Histograms of the Gaia DR2 amplitude for Mira and SRa/SRb periodic variables of the General Catalogue of Variable Stars (Samus et al. 2017). The Gaia amplitude has been defined by Deason et al. (2017) and combines the Gaia G flux, its fluctuations, and the number of measurements (see Sect. 3.1, 2nd paragraph). The Gaia amplitude histogram is plotted in log here.
Current usage metrics show cumulative count of Article Views (full-text article views including HTML views, PDF and ePub downloads, according to the available data) and Abstracts Views on Vision4Press platform.
Data correspond to usage on the plateform after 2015. The current usage metrics is available 48-96 hours after online publication and is updated daily on week days.
Initial download of the metrics may take a while.