Fig. 3
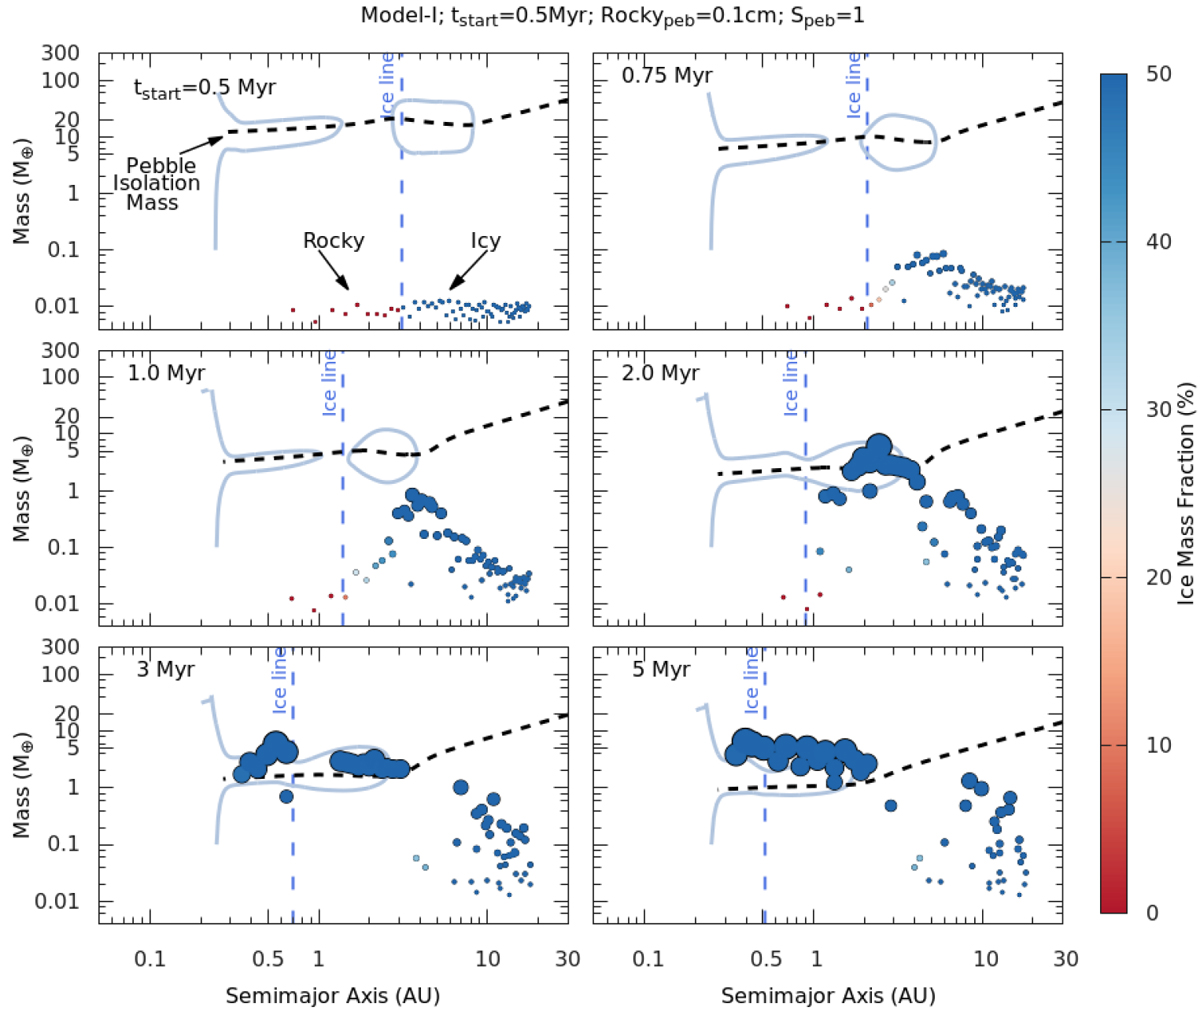
Evolution of an example simulation from model I. The panels represent snapshots of the growth of protoplanetary embryos in a simulation with tstart = 0.5 Myr, Speb = 1, and a size of the rocky pebbles equal to Rocky_peb = 0.1 cm. The vertical and horizontal axes represent mass and semi-major axis, respectively. The location of the disk snow line (blue vertical dashed line) and the pebble isolation mass (black dashed line) are also shown for reference as the disk evolves. Planetary embryos growing inside the snow line accrete silicate pebbles while those outside the snow line accrete icy pebbles. The gray solid lines delimit the region of outward migration. The disk inner edge is shown at ~ 0.3 AU, where planets are trapped as well. The color of each dot gives the ice mass fraction. The size of each dot scales as m1∕3, where m is the planetary mass. The exact time evolution is shown in Fig. 4.
Current usage metrics show cumulative count of Article Views (full-text article views including HTML views, PDF and ePub downloads, according to the available data) and Abstracts Views on Vision4Press platform.
Data correspond to usage on the plateform after 2015. The current usage metrics is available 48-96 hours after online publication and is updated daily on week days.
Initial download of the metrics may take a while.