Fig. 23
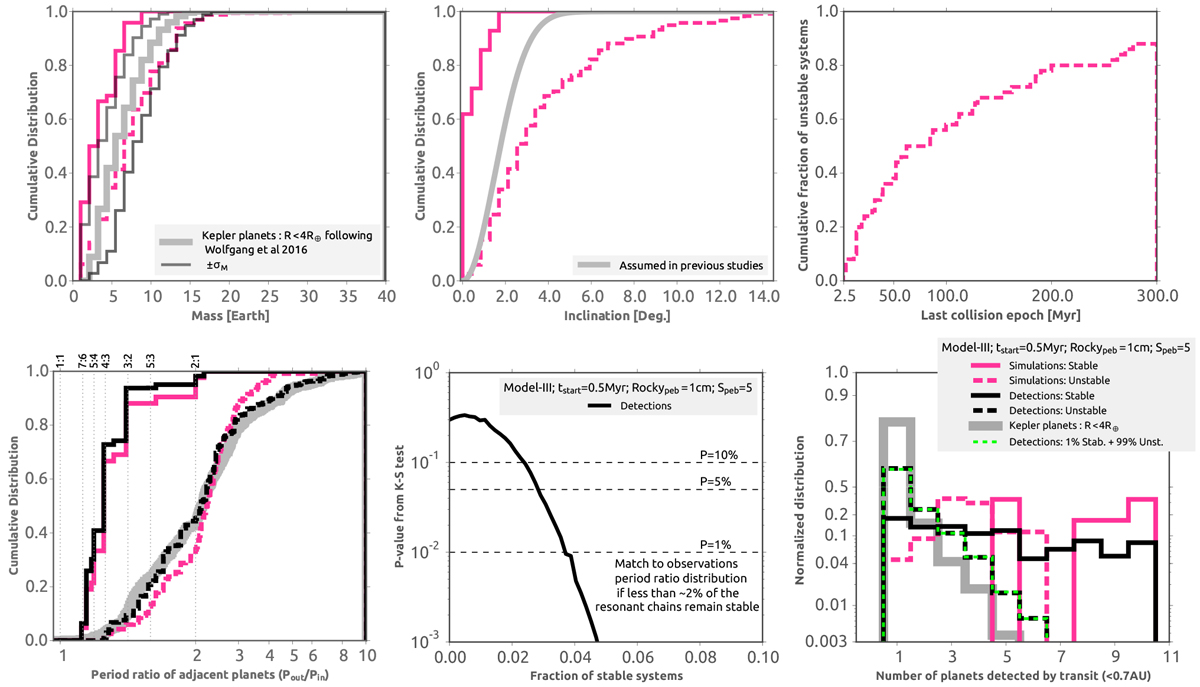
Statistics of simulations of Model III with tstart = 0.5 Myr, Speb = 5, and Rockypeb = 1 cm. Solid lines show stable systems, and dashed lines show unstable systems. The black lines show the results of our synthetic observations. The thick gray lines represent the Kepler planets. Upper-left panel: period ratio distribution of simulations and observations. Upper-right panel: KS-tests between the Kepler period ratio sample and our simulated detections of distributions mixing different real fractions of stable and unstable systems. Bottom-left panel: planet multiplicity distribution.The densely dashed green line shows the detected multiplicity distribution for a mix of 1% stable and 99% unstable systems. Bottom-right panel: distribution of the last collision epoch after gas dispersal. About 88% of these systems became unstable after gas dispersal.
Current usage metrics show cumulative count of Article Views (full-text article views including HTML views, PDF and ePub downloads, according to the available data) and Abstracts Views on Vision4Press platform.
Data correspond to usage on the plateform after 2015. The current usage metrics is available 48-96 hours after online publication and is updated daily on week days.
Initial download of the metrics may take a while.