Fig. 19
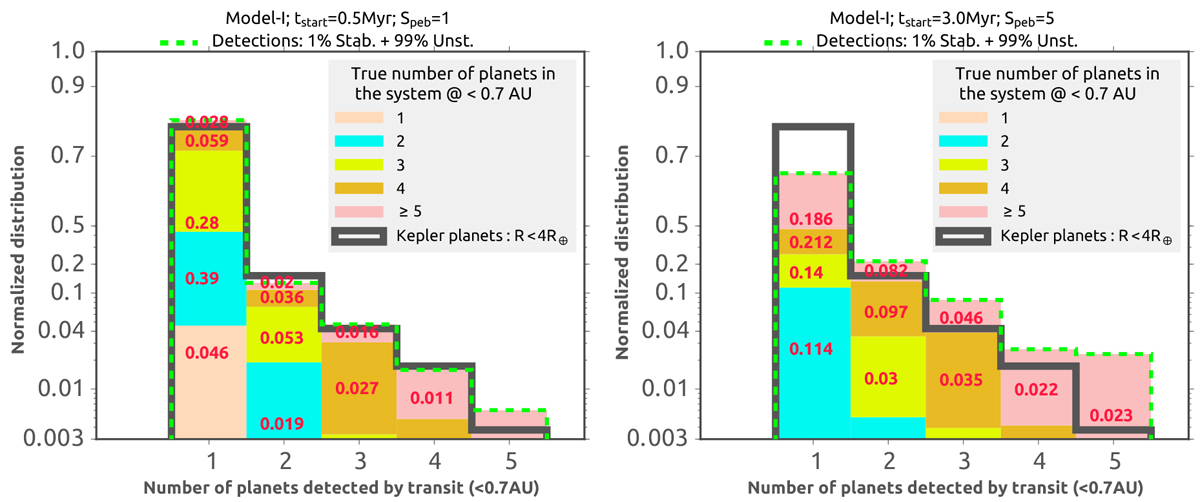
Number of planets detected by transit in synthetic observations of planetary systems of two sets of simulations of Model I. The colors filling the dashed green histogram bins show the fractional contributions as a function of true system multiplicity. Left and right panels: simulations with tstart = 0.5 Myr, and tstart = 3.0 Myr, respectively. In both cases we use Rockypeb = 0.1 cm. The dashed green histograms show detection distributions considering different real mixing ratios of stable and unstable systems, as in Fig. 18. The over-plotted red numbers show the size of each colored sub-bar representing fractional contributions. We note that the y-axes combine linear and log scaling.
Current usage metrics show cumulative count of Article Views (full-text article views including HTML views, PDF and ePub downloads, according to the available data) and Abstracts Views on Vision4Press platform.
Data correspond to usage on the plateform after 2015. The current usage metrics is available 48-96 hours after online publication and is updated daily on week days.
Initial download of the metrics may take a while.