Fig. 18
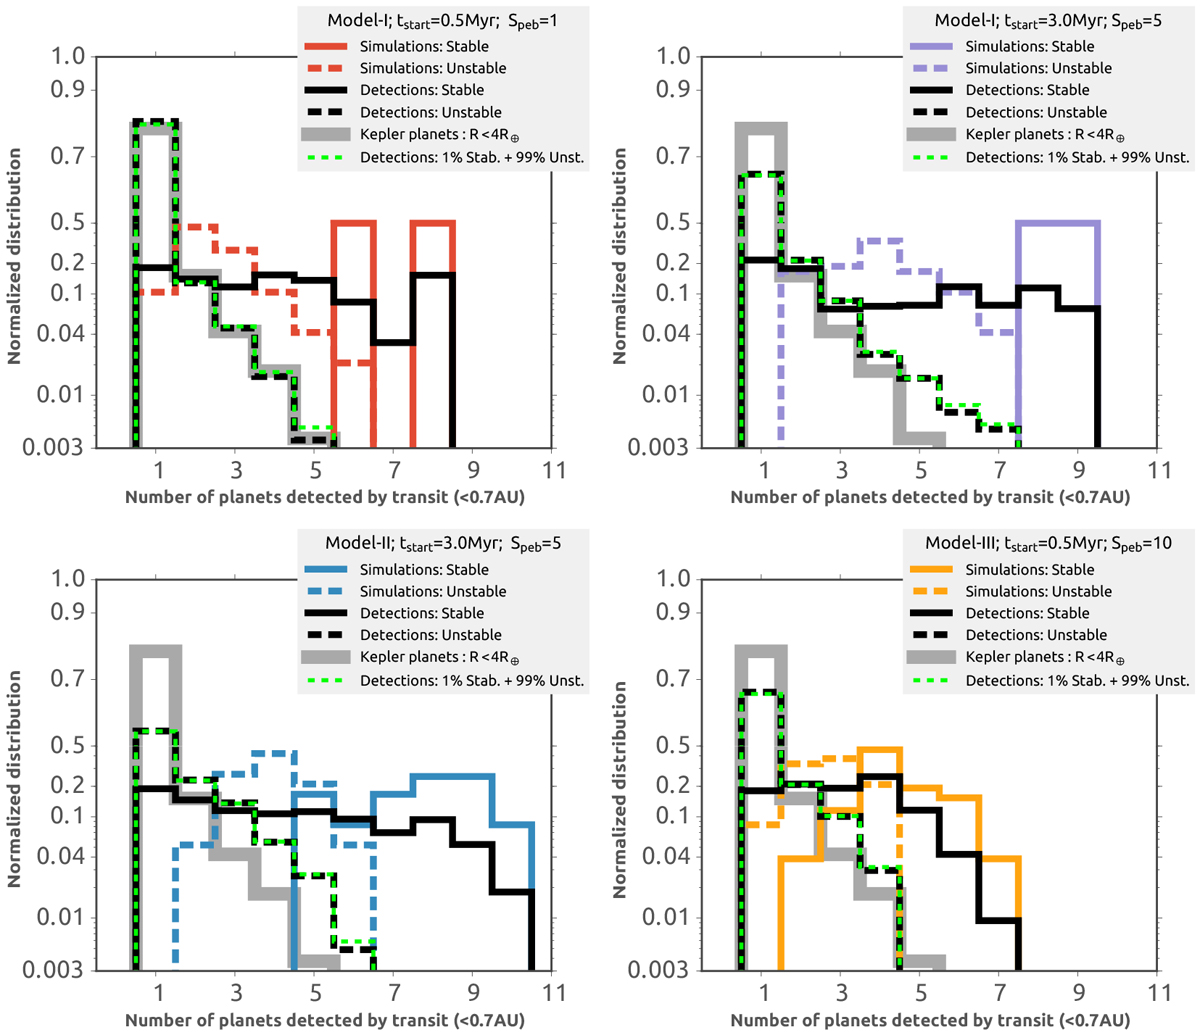
Number of planets detected by transit in synthetic observations of planetary systems produced in our N-body simulations of Model I with tstart = 0.5 Myr and Speb = 1 (red), ModelI with tstart = 3.0 Myr and Speb = 5 (purple), Model II with tstart = 3.0 Myr and Speb = 5 (blue), and Model III with tstart = 0.5 Myr and Speb = 10 (yellow). Forall cases, Rockypeb = 0.1 cm. Solid lines show stable systems, and dashed lines show unstable systems. The black lines show the results of our synthetic observations. The densely dashed green lines show multiplicity distribution combining different real fractions of stable and unstable systems. We note that the y-axes combine linear and log scaling.
Current usage metrics show cumulative count of Article Views (full-text article views including HTML views, PDF and ePub downloads, according to the available data) and Abstracts Views on Vision4Press platform.
Data correspond to usage on the plateform after 2015. The current usage metrics is available 48-96 hours after online publication and is updated daily on week days.
Initial download of the metrics may take a while.