Fig. 17
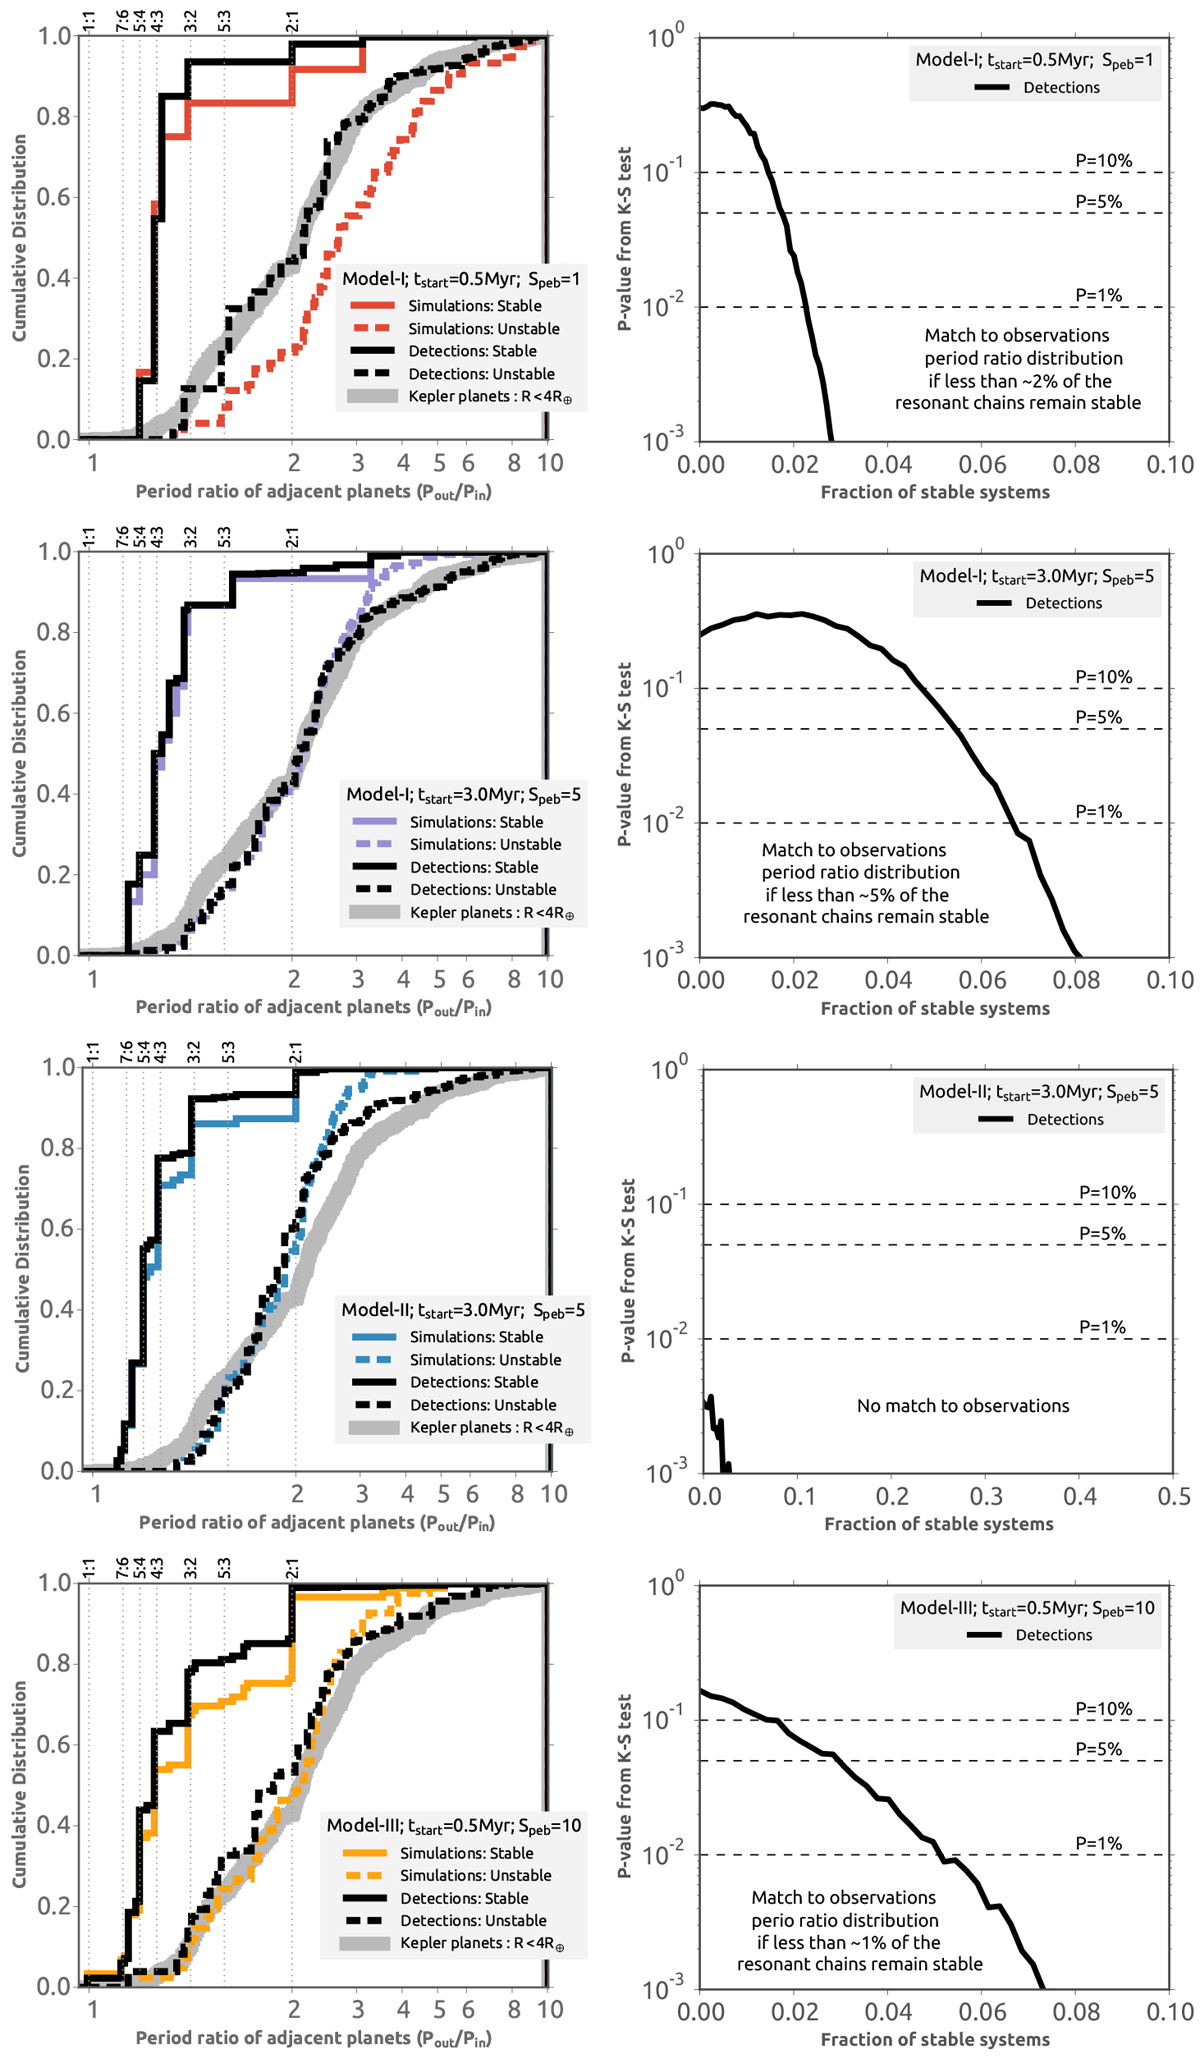
Left-hand panels: period ratio distribution of simulations of Model-I with tstart = 0.5 Myr (red), Model-I with tstart = 3.0 Myr (purple), and Model-III with tstart = 0.5 Myr (yellow). In all cases Rockypeb=0.1 cm. The black lines show the period ratio distribution of detected planet pairs in synthetic observations of our real systems. Solid lines show stable systems. Dashed lines show unstable systems. The gray line shows the Kepler sample. Right-hand panels: p-values of Kolmogorov-Smirnof tests between the Kepler sample and simulated detection of samples mixing different fractions of stable and unstable systems.
Current usage metrics show cumulative count of Article Views (full-text article views including HTML views, PDF and ePub downloads, according to the available data) and Abstracts Views on Vision4Press platform.
Data correspond to usage on the plateform after 2015. The current usage metrics is available 48-96 hours after online publication and is updated daily on week days.
Initial download of the metrics may take a while.