Fig. 15
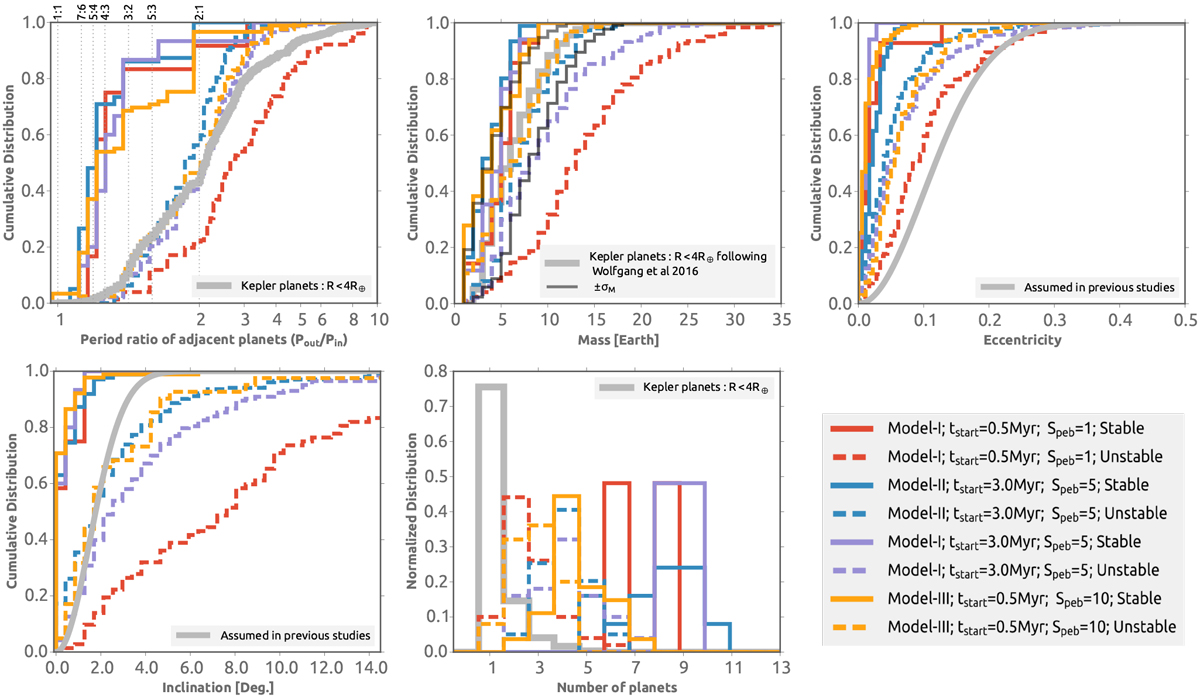
Dynamical architecture of stable and unstable planetary systems anchored at the disk inner edge at the end of the simulations (50 Myr). From left to right, the top panels: cumulative distributions of period ratio, mass, and orbital eccentricity. From left to right, the bottom panels: distributions of orbital inclination and number of planets. Only planets with semi-major axes smaller than 0.7 AU and masses larger than 1 M⊕ are considered. In all considered models Rockypeb = 0.1 cm. The Kepler planet mass distribution inferred from the mass–radius relationship of Wolfgang et al. (2016) is shown as a thick gray line. The uncertainty in the mass distribution is shown by the thin gray lines (M ± σM).
Current usage metrics show cumulative count of Article Views (full-text article views including HTML views, PDF and ePub downloads, according to the available data) and Abstracts Views on Vision4Press platform.
Data correspond to usage on the plateform after 2015. The current usage metrics is available 48-96 hours after online publication and is updated daily on week days.
Initial download of the metrics may take a while.