Fig. 10
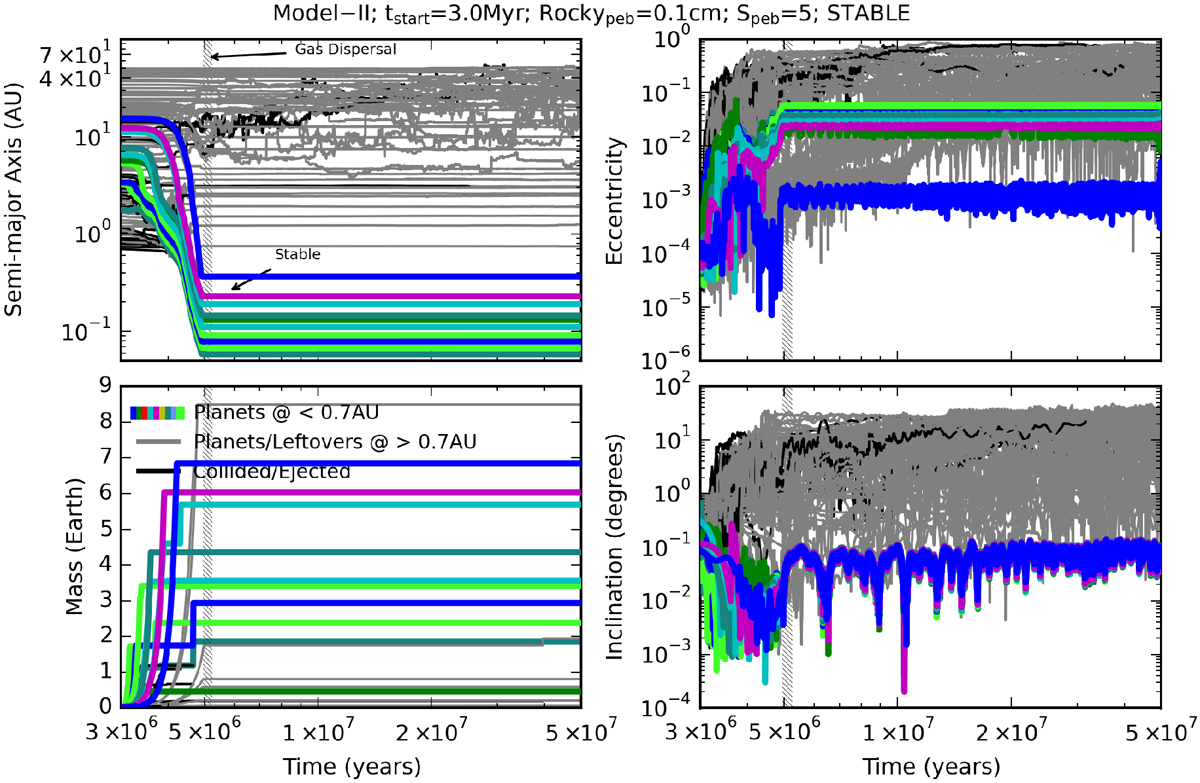
Growth and long-term dynamical evolution of protoplanetary embryos in a simulation of Model II where tstart = 3.0 Myr, Speb = 5, and the size of the rocky pebbles is Rockypeb = 0.1 cm. The top left panel: evolution of semi-major axes. Top right panel: evolution of the eccentricities. Bottom left and right panels: mass growth and the orbital inclinations, respectively. Colored lines show the final planets orbiting inside 0.7 AU. The gray lines show final planets and leftover protoplanetary embryos with orbits outside 0.7 AU. Leftover embryos are those with masses smaller than ~ 0.1 M⊕. Finally, the black lines show collided or ejected objects over the course of the simulation. The dashed vertical line shows the instant of the gas disk dispersal. After gas disk dispersal the resonant chains of super-Earths anchored at the inner edge of the disk remain dynamically stable during the total integration time of 50 Myr.
Current usage metrics show cumulative count of Article Views (full-text article views including HTML views, PDF and ePub downloads, according to the available data) and Abstracts Views on Vision4Press platform.
Data correspond to usage on the plateform after 2015. The current usage metrics is available 48-96 hours after online publication and is updated daily on week days.
Initial download of the metrics may take a while.