Fig. 1
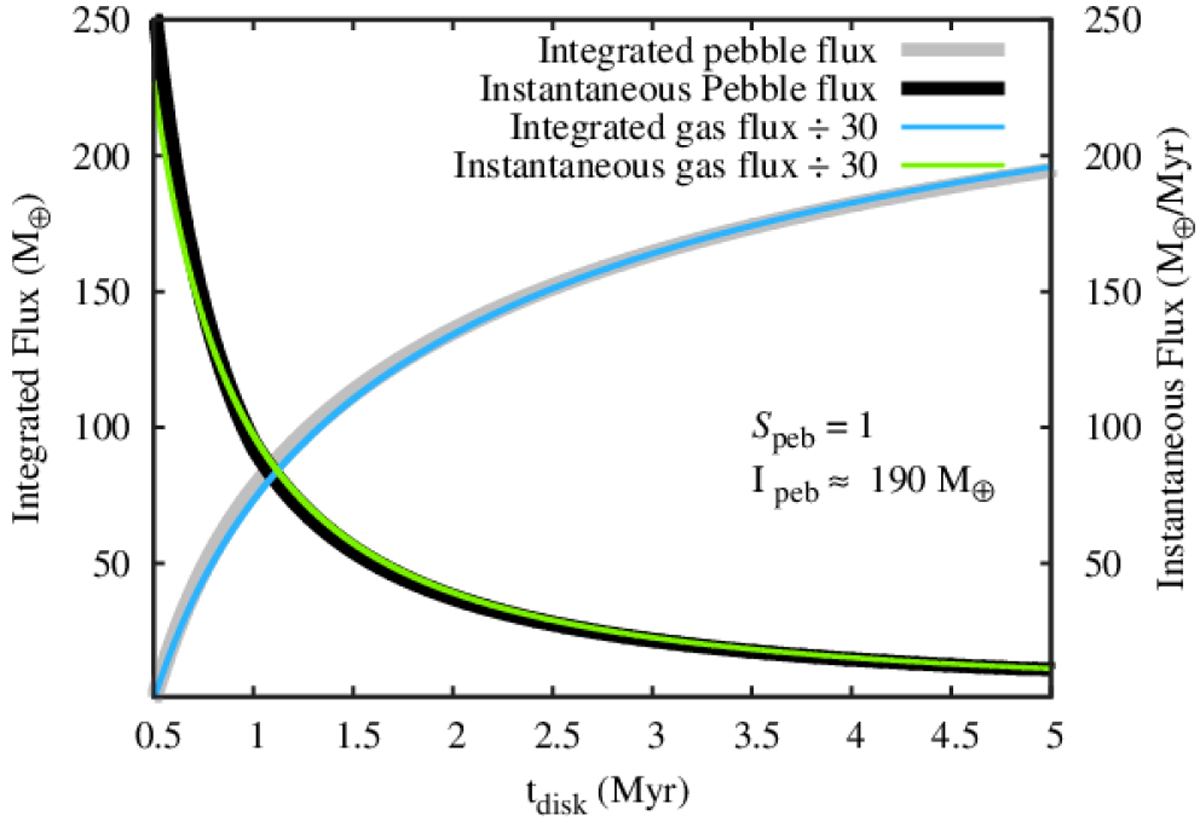
Pebble flux in our nominal disk model. The integrated mass in drifted pebbles (Ipeb) is shown on the left-hand vertical axis as a function of disk age (tdisk). Fluxes are calculated at 5 AU. The right-hand vertical axis shows the instantaneous pebble flux decreasing as the disk dissipates. Simulations of Paper I and III also feature the decay of the pebble flux. All our simulations start with a tdisk of at least 0.5 Myr, thus the pebble production line is already past the initial positions of our outermost seeds (~ 60 AU; see Table 1). This plot is generated considering Speb = 1 in Eq. (13) but a simple rescaling of these curves accounts for other considered pebble fluxes. Both curves correspond to the pebble flux beyond the snow line. The pebble flux inside the snow line is reduced by a factor of two because of the mass sublimation of the ice component of the pebbles when they cross the snow line. The gas flux and the integrated gas flux in our gas disk model are shown by the green and blue lines, respectively. We note that in the plot we rescaled the gas flux by a factor of 1/30, for clear comparison with the pebble flux.
Current usage metrics show cumulative count of Article Views (full-text article views including HTML views, PDF and ePub downloads, according to the available data) and Abstracts Views on Vision4Press platform.
Data correspond to usage on the plateform after 2015. The current usage metrics is available 48-96 hours after online publication and is updated daily on week days.
Initial download of the metrics may take a while.