Free Access
Fig. 3.
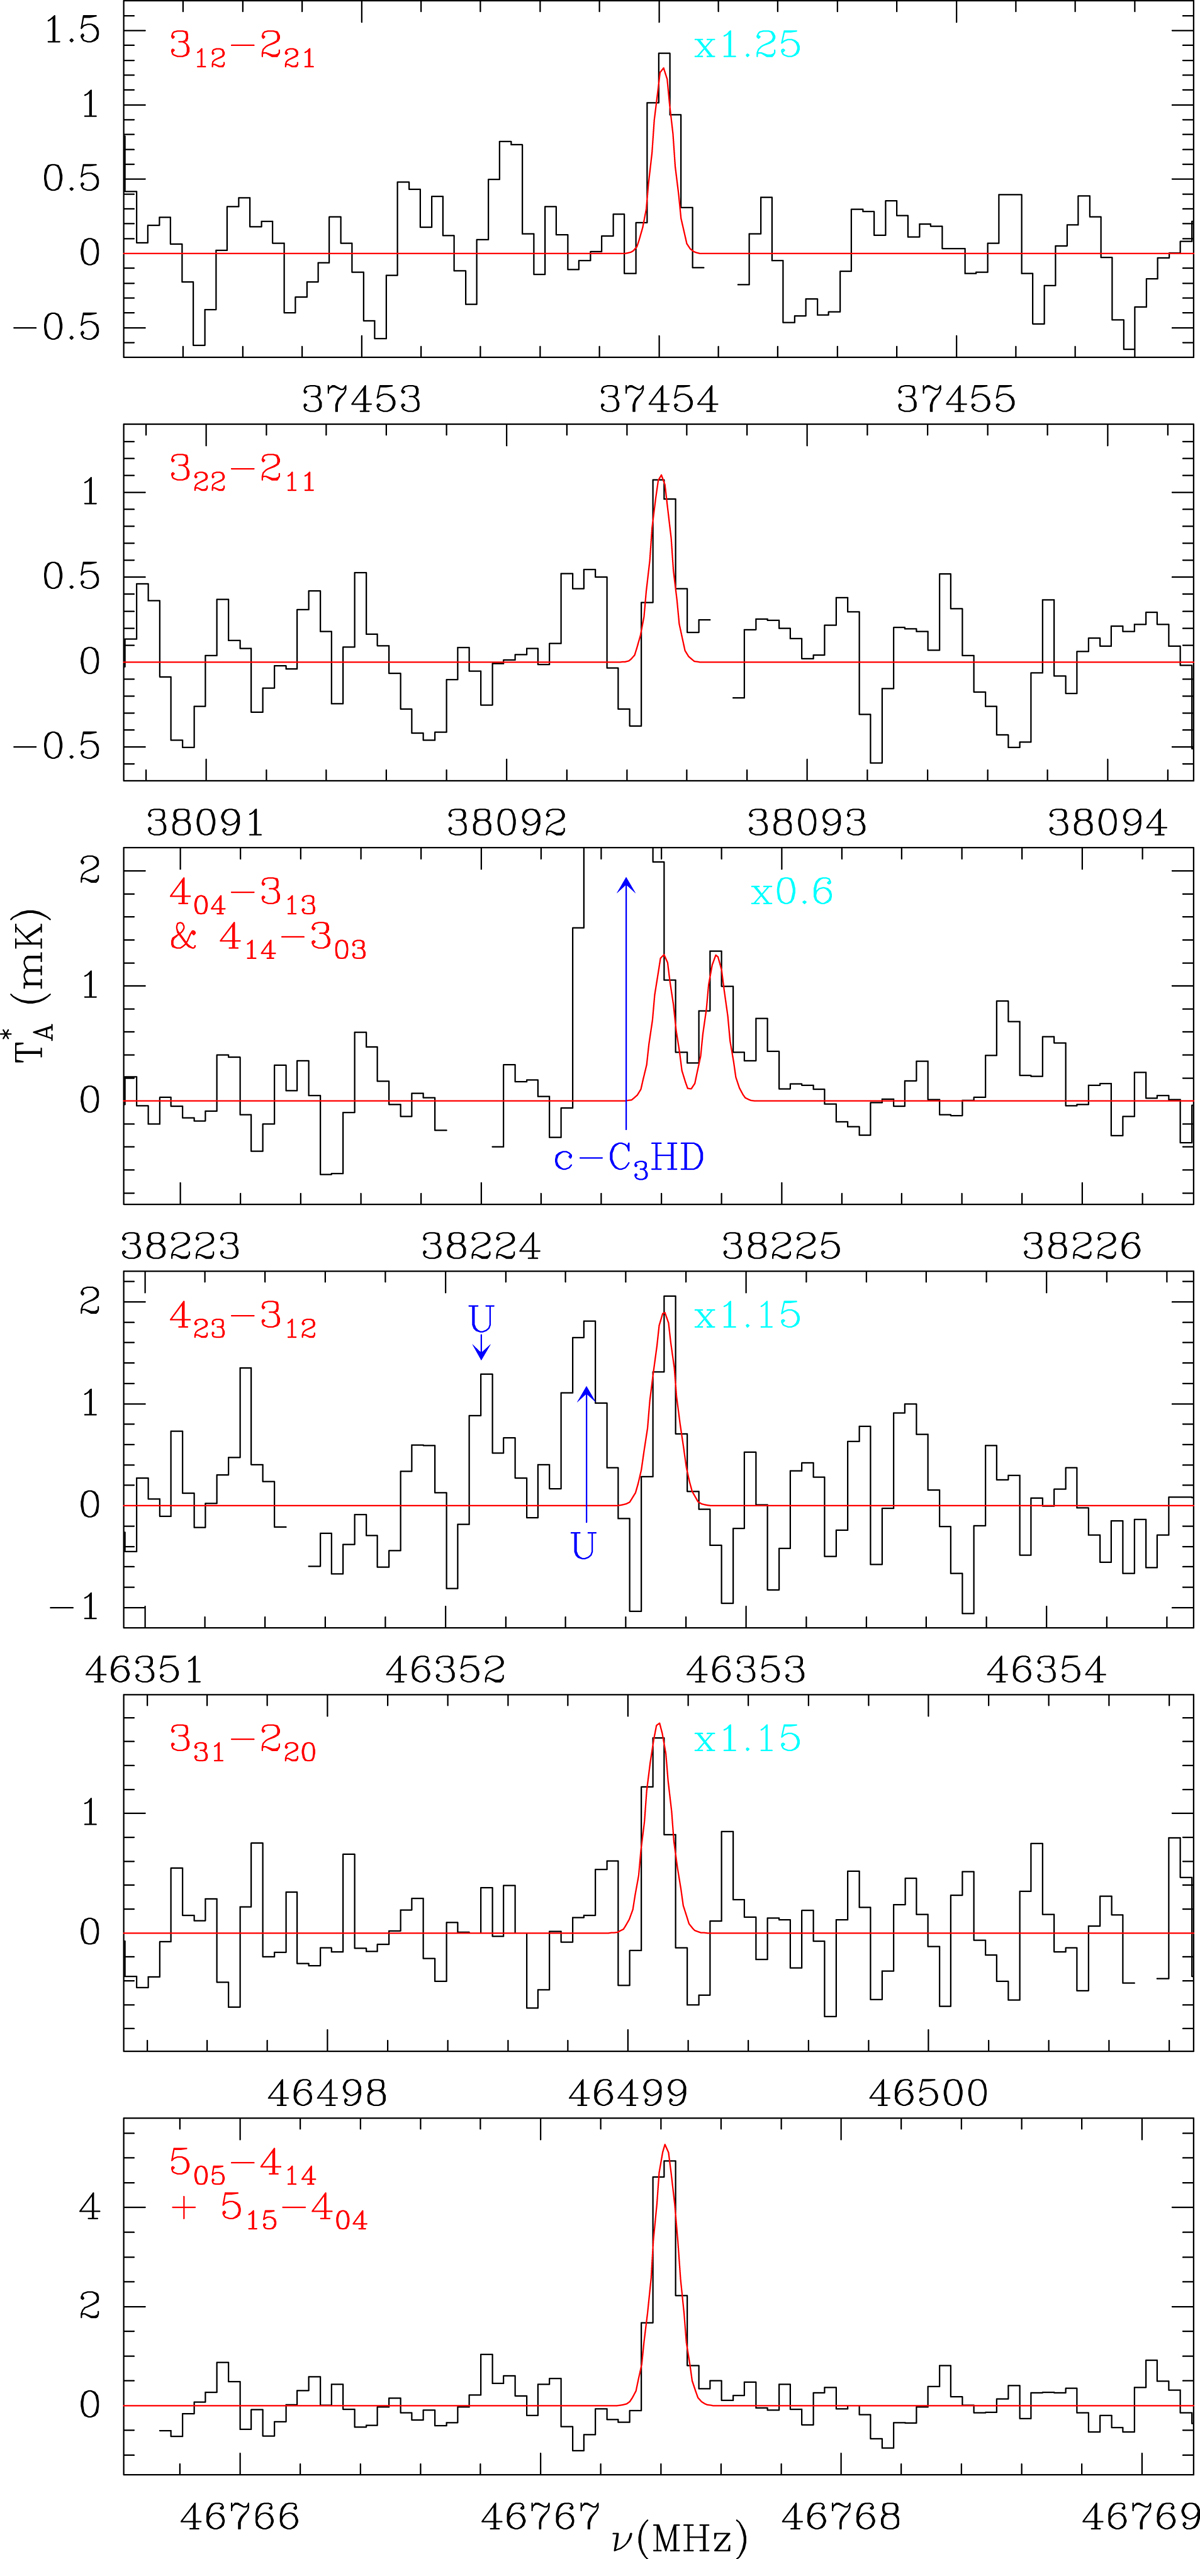
Same as Fig. 2 but for the observed transitions of c-C5H6 towards TMC-1. The red line shows the computed synthetic spectrum for cyclopentadiene assuming Tr = 10 K and N(c-C5H6) = 1.2 × 1013 cm−2. Cyan labels, when present, indicate the multiplicative factor applied to the best fit model to match the observations.
Current usage metrics show cumulative count of Article Views (full-text article views including HTML views, PDF and ePub downloads, according to the available data) and Abstracts Views on Vision4Press platform.
Data correspond to usage on the plateform after 2015. The current usage metrics is available 48-96 hours after online publication and is updated daily on week days.
Initial download of the metrics may take a while.