Fig. 2.
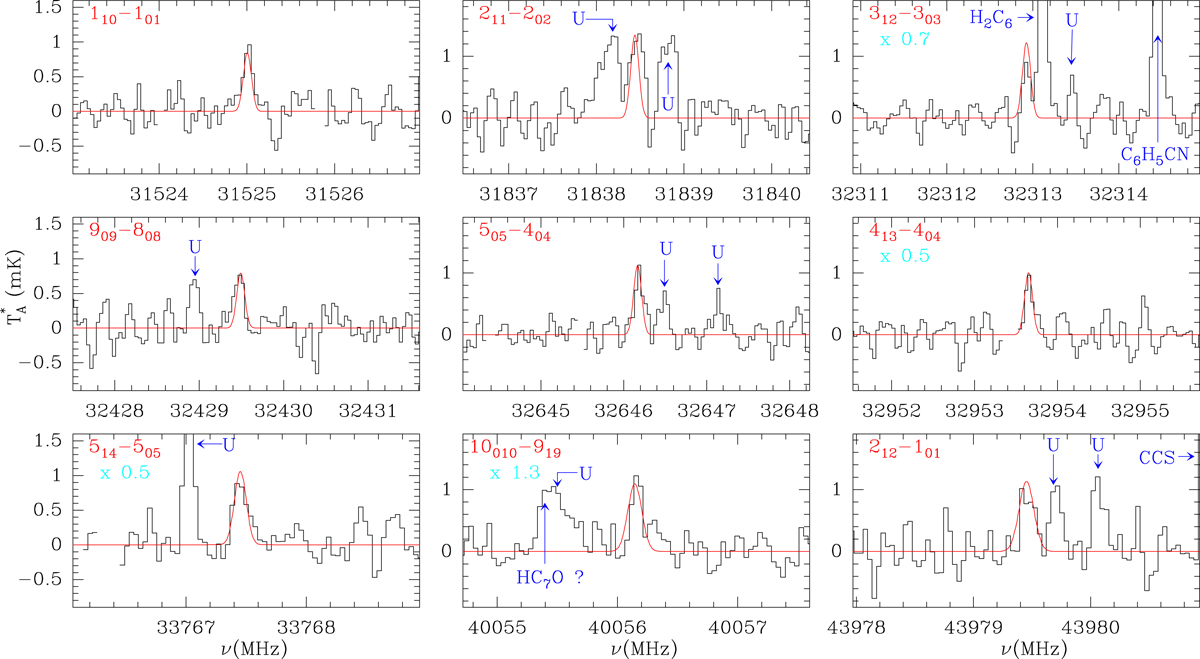
Selected transitions of c-C3HCCH in TMC-1. The abscissa corresponds to the rest frequency of the lines, assuming a local standard of rest velocity of the source of 5.83 km s−1. Frequencies and intensities for the observed lines are given in Table A.1. The ordinate is the antenna temperature, corrected for atmospheric and telescope losses, in millikelvins. The quantum numbers for each transition are indicated in the upper left corner of the corresponding panel. The red lines show the computed synthetic spectrum for this species for Tr = 10 K and a column density of 3.1 × 1011 cm−2. Cyan labels indicate the multiplicative factor applied to the model to match the intensity of the observed lines.
Current usage metrics show cumulative count of Article Views (full-text article views including HTML views, PDF and ePub downloads, according to the available data) and Abstracts Views on Vision4Press platform.
Data correspond to usage on the plateform after 2015. The current usage metrics is available 48-96 hours after online publication and is updated daily on week days.
Initial download of the metrics may take a while.