Fig. 1.
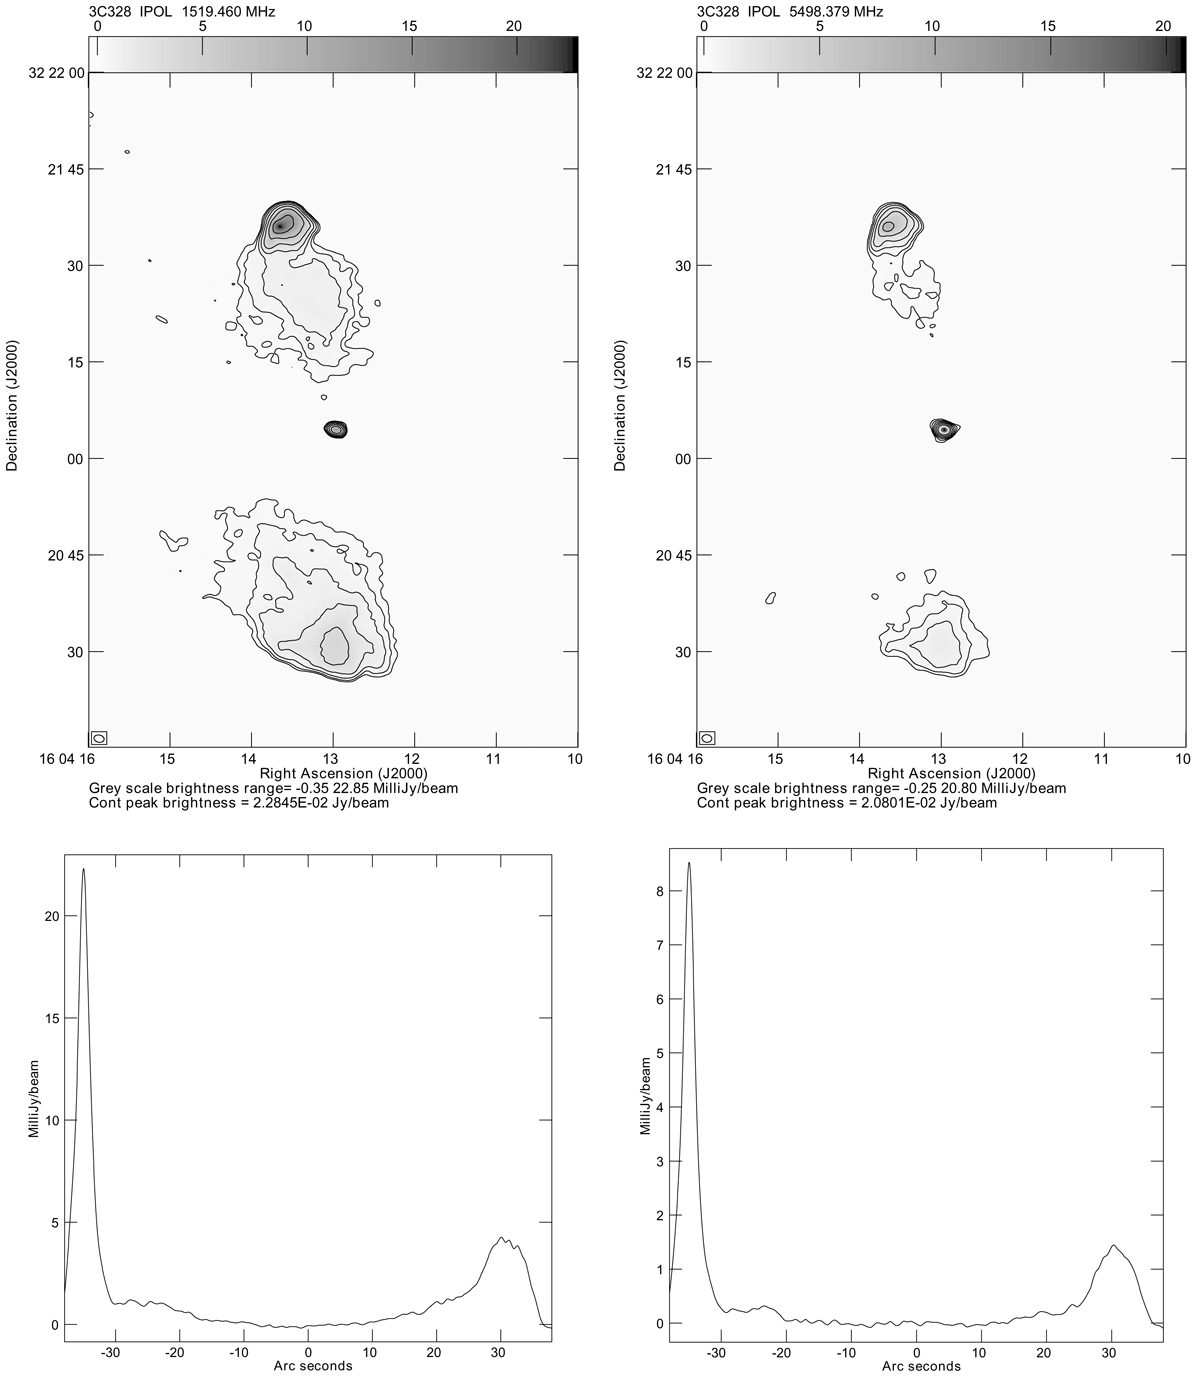
Outcome of the VLA observations. Upper panels: images of 3C 328 at 1.5 GHz (left-hand panel) and at 5.5 GHz (right-hand panel). In both images, contours are at 0.2, 0.4, 0.8, 1.6, 3.2, 6.4, 12.8, and 25.6 mJy beam−1. Lower panels: slices across the lobes at 1.5 GHz (left-hand panel) and at 5.5 GHz (right-hand panel). North is on the left-hand side of each plot. The core has been bypassed by both slices.
Current usage metrics show cumulative count of Article Views (full-text article views including HTML views, PDF and ePub downloads, according to the available data) and Abstracts Views on Vision4Press platform.
Data correspond to usage on the plateform after 2015. The current usage metrics is available 48-96 hours after online publication and is updated daily on week days.
Initial download of the metrics may take a while.